2025年SCA价格预测:专家深度解析与Siacoin明年市场前景
2025-12-23 14:34:36
山寨币
加密生态系统
加密视野
DeFi
投资加密货币
文章评价 : 3
111 个评价
查阅 Scallop (SCA) 2025 年市场的专家分析和前瞻预测,全面解读历史趋势、市场变动及专业投资策略,助力布局 Sui 生态中的头部 DeFi 协议。深入剖析宏观经济环境、机构参与和创新进展对 SCA 价格走势直至 2030 年的影响。Gate 提供风险管控要点与战略建议,助您在动态市场中做出更有洞察力的投资决策。
简介:SCA的市场地位与投资价值
Scallop(SCA)是Sui生态首个获得Sui基金会官方资助的下一代点对点货币市场协议,开创了DeFi协议先河。自2023年3月上线以来,Scallop展现了机构级品质与强大的安全架构。截至2025年12月,SCA市值约468万美元,流通量约10640万枚,现价0.044美元。作为“机构级DeFi协议”,SCA正依托统一平台,在高息借贷、低费借款、自动做市(AMM)与面向专业交易者的可编程交易工具等方面,持续重塑Sui生态格局。
本文将结合历史表现、市场供给、生态发展及宏观经济因素,全面分析SCA至2030年价格趋势,为投资者提供专业价格预测与实用投资策略。
Scallop(SCA)市场分析报告
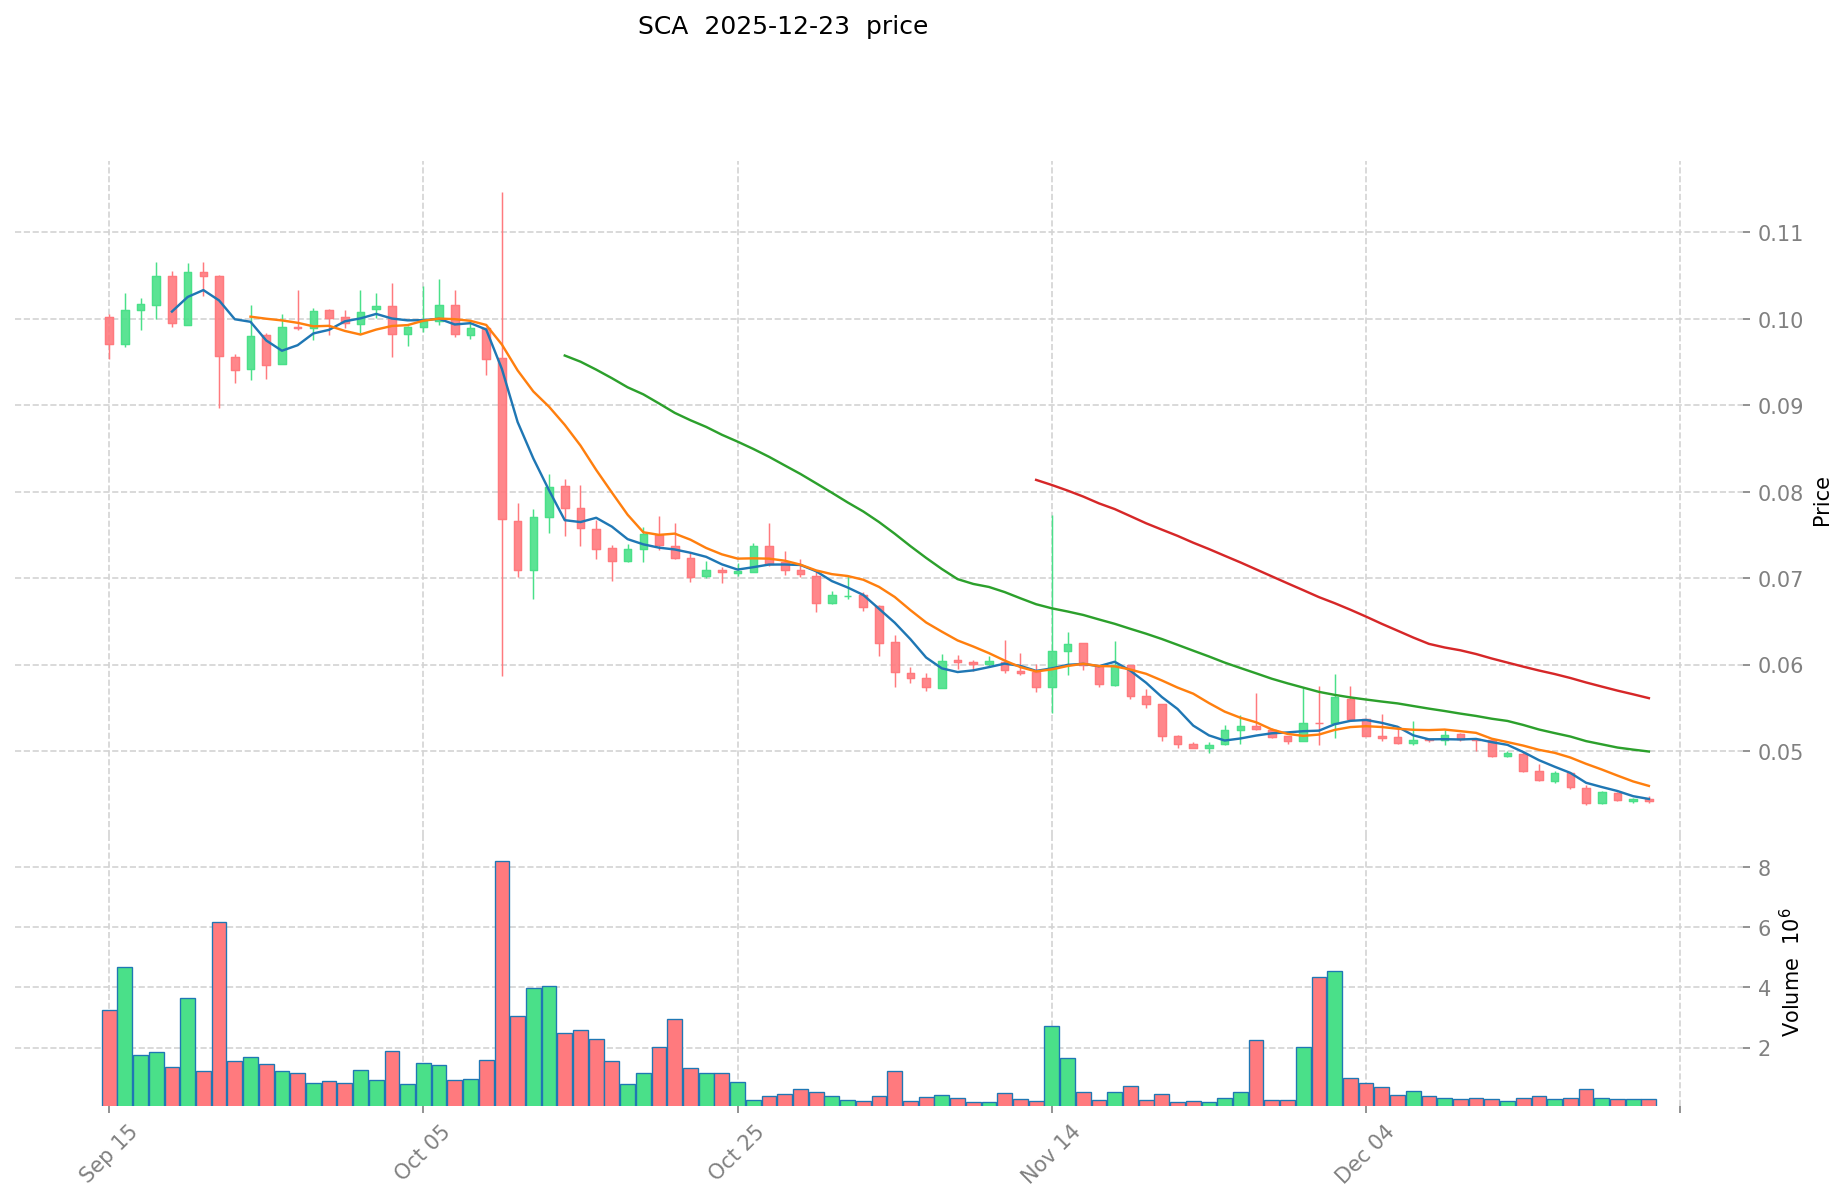
一、SCA价格历史回顾与市场现状
SCA历史价格轨迹
- 2024年3月:2024年3月9日,Scallop创下上市以来最高价1.5477美元。
- 2024-2025年:经历长期熊市,SCA随市况恶化大幅贬值。
- 2025年12月:2025年12月18日,SCA跌至历史最低0.04371美元,年跌幅达84.26%。
SCA当前市场状况
2025年12月23日,Scallop(SCA)现价0.044美元,近一小时小幅上涨+0.09%,但24小时跌幅-0.76%,7天跌幅-7.33%,走势偏弱。
主要市场数据:
- 24小时价格区间:0.04392 - 0.04446美元
- 24小时成交量:12492.88美元
- 市值:4681713.08美元
- 完全稀释估值:1100万美元
- 流通量:106402570 SCA(占总供应量42.56%)
- 总供应量:250000000 SCA
- 持币地址数:6705
- 市场排名:1567
该币已在17家交易所挂牌,近一年跌幅-84.26%,30天表现亦为-13.38%。当前市场极度恐慌,成交活跃度远低于市值。
点击查看当前SCA市场价格
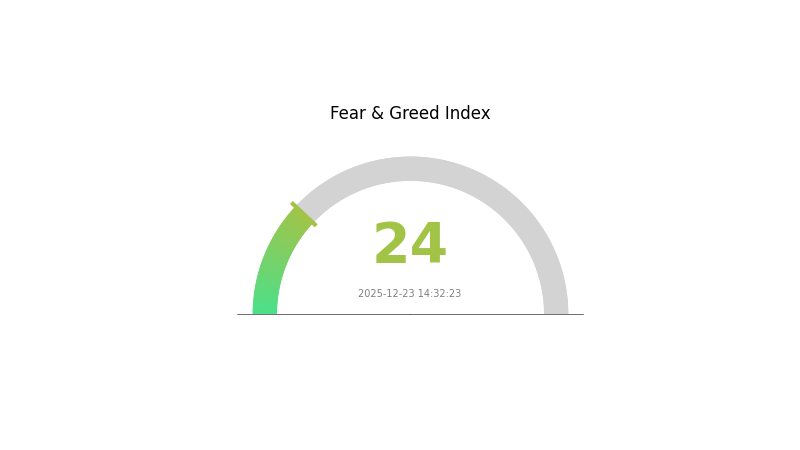
SCA市场情绪指数
2025年12月23日恐惧与贪婪指数:24(极度恐慌)
点击查看当前恐惧与贪婪指数
当前加密市场极度恐慌,指数24,普遍投资者情绪低迷。极度恐慌下,风险规避者削减仓位,逆势交易者则寻找超跌机会。市场波动居高不下,情绪持续低迷。Gate.com可实时监控该指数,助力交易者把握市场心理,调整熊市投资策略。
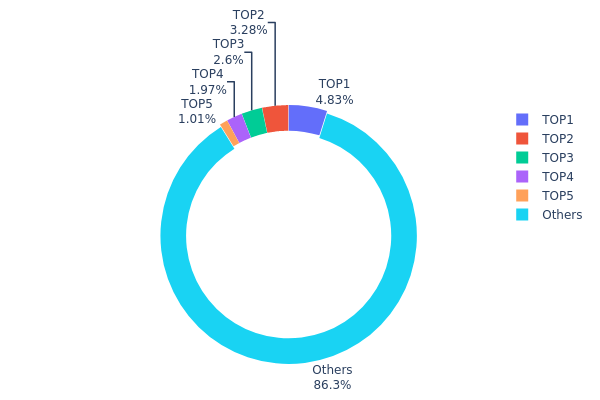
SCA持币分布
地址分布图追踪各地址持币比例,是衡量去中心化、市场脆弱性及潜在操控风险的重要依据。
SCA前五大地址共持13.69%,头号地址占4.83%,分布较为分散,无单一主体主导市场。其余86.31%由众多地址分散持有,市场权力与价格发现机制分散,难被大户操控。
该结构有效降低协同操控或突发抛售导致剧烈波动的风险。头部地址持仓有限,难以单边影响市场,价格更具韧性。整体分布体现机构与散户多元参与,市场结构成熟,稳定性提升,系统性风险下降。
点击查看SCA持币分布
| 排名 | 地址 | 持币数量 | 持币比例 |
|---|---|---|---|
| 1 | 0x60dd...b0984d | 12082.51K | 4.83% |
| 2 | 0x62f3...fa53ad | 8212.04K | 3.28% |
| 3 | 0xa7be...d0de0b | 6500.00K | 2.60% |
| 4 | 0x4558...3b2baa | 4937.40K | 1.97% |
| 5 | 0x9995...90d25d | 2529.13K | 1.01% |
| - | 其他 | 215738.92K | 86.31% |
影响SCA未来价格的核心因素
宏观经济环境
-
抗通胀属性:SCA作为加密资产,在特定经济环境下具备一定抗通胀潜力,对长期价值保值有重要影响。
-
全球经济动态:全球货币政策及经济趋势影响加密市场情绪与资金流向,直接作用于SCA价格。
机构与市场动态
-
机构资金流入:机构参与是SCA价格的核心驱动力,机构级资金流入尤为关键,尤其在市场扩张期。
-
市场情绪与趋势:整体市场情绪与投资者预期共同作用,影响SCA价格走势。
成长阶段发展
- 主要驱动(2027年中期预测):市场分析认为,SCA将在2027年进入增长阶段,预计价格区间为0.0302-0.0670美元。主要催化包括机构资金流、ETF产品开发及生态扩展。
注:本分析基于2025年12月23日数据。投资者务必自行调研并咨询专业顾问。更多加密货币交易与分析工具请访问Gate.com。
三、2025-2030年SCA价格预测
2025年展望
- 保守预测:0.03876-0.04405美元
- 中性预测:0.04405-0.0533美元
- 乐观预测:0.0533美元(需持续市场动能及生态利好)
2026-2028年中期展望
- 市场阶段预期:SCA将进入稳步升值周期,市场认知与应用提升,价格逐步发现,波动趋于收敛。
- 价格区间预测:
- 2026年:0.02677-0.0662美元
- 2027年:0.04652-0.06892美元
- 2028年:0.05939-0.07013美元
- 关键催化:协议功能升级、战略合作扩展、机构兴趣提升、市场复苏。
2029-2030年长期展望
- 基础预测:0.04199-0.08665美元(假设采纳加速与宏观稳定)
- 乐观预测:0.06666-0.08665美元(假设生态扩容与监管利好)
- 变革预测:0.07665-0.08049美元(假设技术创新与机构主流采纳)
- 2030年12月23日:SCA预计均价为0.08049美元,较当前基线上涨74%
| 年份 | 预测最高价 | 预测均价 | 预测最低价 | 涨跌幅 |
|---|---|---|---|---|
| 2025 | 0.0533 | 0.04405 | 0.03876 | 0 |
| 2026 | 0.0662 | 0.04868 | 0.02677 | 10 |
| 2027 | 0.06892 | 0.05744 | 0.04652 | 30 |
| 2028 | 0.07013 | 0.06318 | 0.05939 | 43 |
| 2029 | 0.08665 | 0.06666 | 0.04199 | 51 |
| 2030 | 0.08049 | 0.07665 | 0.03986 | 74 |
Scallop(SCA)投资策略与风险管理报告
四、SCA投资策略与风险管理
SCA投资方法论
(1)长期持有策略
- 适用对象:DeFi协议信仰者及Sui生态支持者,具备中长期投资规划
- 操作建议:
- 在价格低于0.045美元区间分批布局,依托协议的机构级基础设施及Sui基金会资助背景
- 穿越周期持有,认可Scallop作为Sui生态下一代点对点货币市场定位
- 参与协议治理和流动性挖矿,获取除币价升值外的额外收益
(2)主动交易策略
- 技术指标参考:
- 24小时波动分析:关注当前价格区间(0.04392-0.04446美元)寻找突破机会
- 7天趋势评估:当前-7.33%跌幅为波段交易者提供潜在入场点
- 波段交易要点:
- 价格逼近历史低点0.04371美元且成交量放大时建仓
- 在阻力位附近分批止盈,历史高点1.5477美元为长期目标参考
SCA风险管理框架
(1)资产配置原则
- 保守型:1-2%仓位(适合低风险偏好者)
- 主动型:3-5%仓位(适合适度风险承受能力且看好DeFi者)
- 专业型:5-10%仓位(适合深度研究Sui生态并具备风险管控者)
(2)风险对冲方案
- 流动性风险管理:多元布局SCA交易对,避免低流动性阶段集中持仓
- 波动保护:极端行情下采用定投策略,降低择时风险
(3)安全存储方案
- 托管方案:使用Gate.com Web3钱包,实现机构级安全自托管
- 冷存储选项:大额持仓建议通过专业托管机构硬件冷存储
- 安全须知:切勿泄露私钥,务必启用多重验证,交易前核验合约地址(SCA合约:0x7016aae72cfc67f2fadf55769c0a7dd54291a583b63051a5ed71081cce836ac6::sca::SCA,链上SUI)
五、SCA潜在风险与挑战
SCA市场风险
- 价格波动风险:SCA一年跌幅高达84.26%,体现早期DeFi协议波动性显著
- 流动性风险:24小时成交量12492.88美元,规模较小,大额卖出易出现滑点
- 市场采纳风险:协议成功依赖Sui生态成长及用户采纳度
SCA合规风险
- DeFi监管不确定:全球去中心化金融监管进展可能影响协议业务
- 司法合规变化:主流市场加密监管调整或影响用户和成交量
- 机构采纳障碍:监管限制机构参与,或导致Scallop机构级定位进展缓慢
SCA技术风险
- 智能合约漏洞:即使重视机构级质量,智能合约仍需持续安全审计
- Sui链依赖性:Scallop表现高度依赖Sui网络稳定性、扩展性及生态成长
- 可组合性复杂性:协议可组合性提升,复杂场景下可能出现交互风险
六、结论与行动建议
SCA投资价值评估
Scallop是Sui生态基础设施潜力项目,拥有Sui基金会官方支持,设计标准严格。协议强调可组合性与可编程性,有望在Sui成长中捕获价值。但需关注其处于早期阶段,市值仅468万美元,流通仅42.56%,且年跌幅达84.26%。长期价值依赖Sui生态采纳度及其在货币市场协议间的竞争力。
SCA投资建议
✅ 新手:可在Gate.com小额布局(0.5-1%仓位),优先理解Sui生态及Scallop定位,后续再逐步加仓
✅ 进阶投资者:建议3-5%配置,积极参与治理与收益策略,结合技术指标在波动期优化进场
✅ 机构投资者:建议5-10%战略配置,并与协议团队直接沟通,探索SDK集成与专业交易,全面评估Sui生态风险敞口
SCA交易参与方式
- 现货交易:于Gate.com市场回调阶段买入SCA,长期持有
- 收益策略:将SCA存入Scallop货币市场赚取借贷收益或参与AMM获取手续费
- 协议参与:参与治理与平台功能,实现多元化收益
加密货币投资风险极高,本报告不构成投资建议。投资者应根据自身风险承受能力决策,并咨询专业顾问。切勿投入超过损失承受限度的资金。
FAQ
什么是sca crypto?
SCA(Scallop)是一种区块链加密货币,驱动Scallop生态系统。其旨在连接传统金融与去中心化金融(DeFi),应对支付慢、手续费高等问题,依托区块链技术实现高效安全金融服务。
SiaCoin最高能涨到多少?
据当前市场趋势与技术分析,SiaCoin在2025年最高可达0.0118美元,2030年有望达到0.0449美元。
影响SCA/SiaCoin价格的因素有哪些?
SiaCoin价格由市场情绪、成交量、网络采纳度、监管变动及比特币联动等因素驱动,供需关系亦对价格波动起决定作用。
SiaCoin在2024年适合投资吗?
SiaCoin在2024年具备较强投资潜力。随着去中心化存储需求增长及区块链基础稳固,SC有望实现可观回报,市场动能及生态发展利好未来价格走势。
SCA历史价格表现怎样?
SCA于2024年3月9日创下历史高点1.49美元。2025年12月23日,24小时价格区间为0.04297-0.0447美元,较峰值回撤97.06%。
* 本文章不作为 Gate 提供的投资理财建议或其他任何类型的建议。 投资有风险,入市须谨慎。


相关文章

DeFi与比特币有何不同?
到2025年,DeFi与比特币的辩论达到了新的高度。随着去中心化金融重塑加密货币格局,了解DeFi的运作方式以及其相对比特币的优势至关重要。这种比较揭示了这两种技术的未来,在金融生态系统中不断演变的角色以及它们对投资者和机构的潜在影响。
2025-08-14 05:20:32

USDC稳定币2025年最新解析:原理、优势及Web3生态应用
USDC稳定币在2025年的加密货币市场中占据主导地位,市值突破600亿美元。作为连接传统金融与数字经济的桥梁,USDC如何运作?它与其他稳定币相比有何优势?在Web3生态系统中,USDC的应用范围有多广?本文将深入探讨USDC的现状、优势及其在数字金融未来中的关键角色。
2025-08-14 05:10:31
USDC市值2025年达到多少?稳定币市场格局分析
USDC市值在2025年迎来爆发性增长,达到617亿美元,占稳定币市场1.78%份额。作为Web3生态系统的重要组成部分,USDC的流通供应量突破616亿枚,其市值与其他稳定币相比呈现强劲上升趋势。本文深入分析USDC市值增长背后的驱动因素,探讨其在加密货币市场中的重要地位。
2025-08-14 05:20:18
什么是DeFi:了解2025年的去中心化金融
去中心化金融(DeFi)在2025年彻底改变了金融格局,提供了挑战传统银行业的创新解决方案。随着全球DeFi市场达到2681亿美元,像Aave和Uniswap这样的平台正在重塑我们与金钱互动的方式。探索这个变革性生态系统中的好处、风险和顶级参与者,正在弥合去中心化和传统金融之间的鸿沟。
2025-08-14 05:02:20

2025年USDT泰达币完全指南:新手投资者必读
在2025年的加密货币世界中,Tether USDT依然是一颗璀璨的明星。作为主导地位的稳定币,USDT在Web3生态系统中扮演着关键角色。本文将深入探讨USDT的运作机制、与其他稳定币的对比,以及如何在Gate平台上购买和使用USDT,助您全面了解这一数字资产的魅力所在。
2025-08-14 05:18:24
2025年去中心化金融生态系统发展:去中心化金融应用与Web3融合
DeFi生态系统在2025年迎来了前所未有的繁荣,市值突破52亿美元大关。去中心化金融应用与Web3深度融合,推动了行业的快速发展。从DeFi流动性挖矿到跨链互操作,创新层出不穷。然而,随之而来的风险管理挑战也不容忽视。本文将深入探讨DeFi的最新发展趋势及其影响。
2025-08-14 04:55:36
猜你喜欢

Gate Ventures 每周加密市场回顾(2026年3月23日)
FOMC 维持政策利率区间在 3.50%–3.75%,仅有一票反对意见支持降息,显示内部已出现早期分歧。Jerome Powell 指出,中东地缘政治不确定性加剧,强调美联储将继续依赖数据,并保持对政策调整的开放态度。
2026-03-23 11:04:21

Gate Ventures 每周加密货币回顾(2026年3月16日)
美国通胀率保持平稳,2 月份消费者价格指数(CPI)同比增长 2.4%。受油价带动的通胀压力持续增强,市场对美联储降息的预期已逐步消退。
2026-03-16 13:34:19


Gate Ventures 每周加密市场回顾(2026年3月2日)
伊朗相关的地缘政治紧张局势加剧,正为全球贸易带来实质性风险,相关影响包括供应链中断、大宗商品价格上涨,以及全球资本配置的变化。
2026-03-02 23:20:41
Gate Ventures 每周加密货币市场回顾(2026年2月23日)
美国最高法院判定特朗普政府时期征收的关税违法,这或将带来退税,从而在短期内提振名义经济增长。
2026-02-24 06:42:31

Gate Ventures 本周加密货币回顾(2026年2月9日)
Kevin Warsh 牵头的资产负债表缩减举措短期内预计不会落地,但中长期依然存在实施的可能性。
2026-02-09 20:15:46