The article "ARCH vs KAVA: Comparing Two Innovative Blockchain Platforms for DeFi and Web3 Development" explores the investment potential and market comparison between Archway (ARCH) and Kava (KAVA). It analyzes historical price trends, tokenomics, adoption scenarios, technological ecosystems, and strategic investment insights. The article targets crypto investors seeking to understand which platform might be a better investment option currently, considering factors like market cap, trading volume, and institutional adoption. Structured in a logical sequence, it covers price history, core value factors, predictions, investment strategies, and risk comparison, offering a comprehensive guide for informed decision-making.
Introduction: ARCH vs KAVA Investment Comparison
In the cryptocurrency market, the comparison between Archway (ARCH) and Kava (KAVA) has been a topic of interest for investors. The two differ significantly in market cap ranking, application scenarios, and price performance, representing different positions in the crypto asset landscape.
Archway (ARCH): Since its launch, it has gained market recognition for its incentivized smart contract platform that rewards developers.
KAVA (KAVA): Established as a cross-chain decentralized financial platform, it has become one of the globally recognized cryptocurrencies in the DeFi space.
This article will comprehensively analyze the investment value comparison between ARCH and KAVA, focusing on historical price trends, supply mechanisms, institutional adoption, technological ecosystems, and future predictions, attempting to answer the question most crucial to investors:
"Which is the better buy right now?"
I. Price History Comparison and Current Market Status
ARCH and KAVA Historical Price Trends
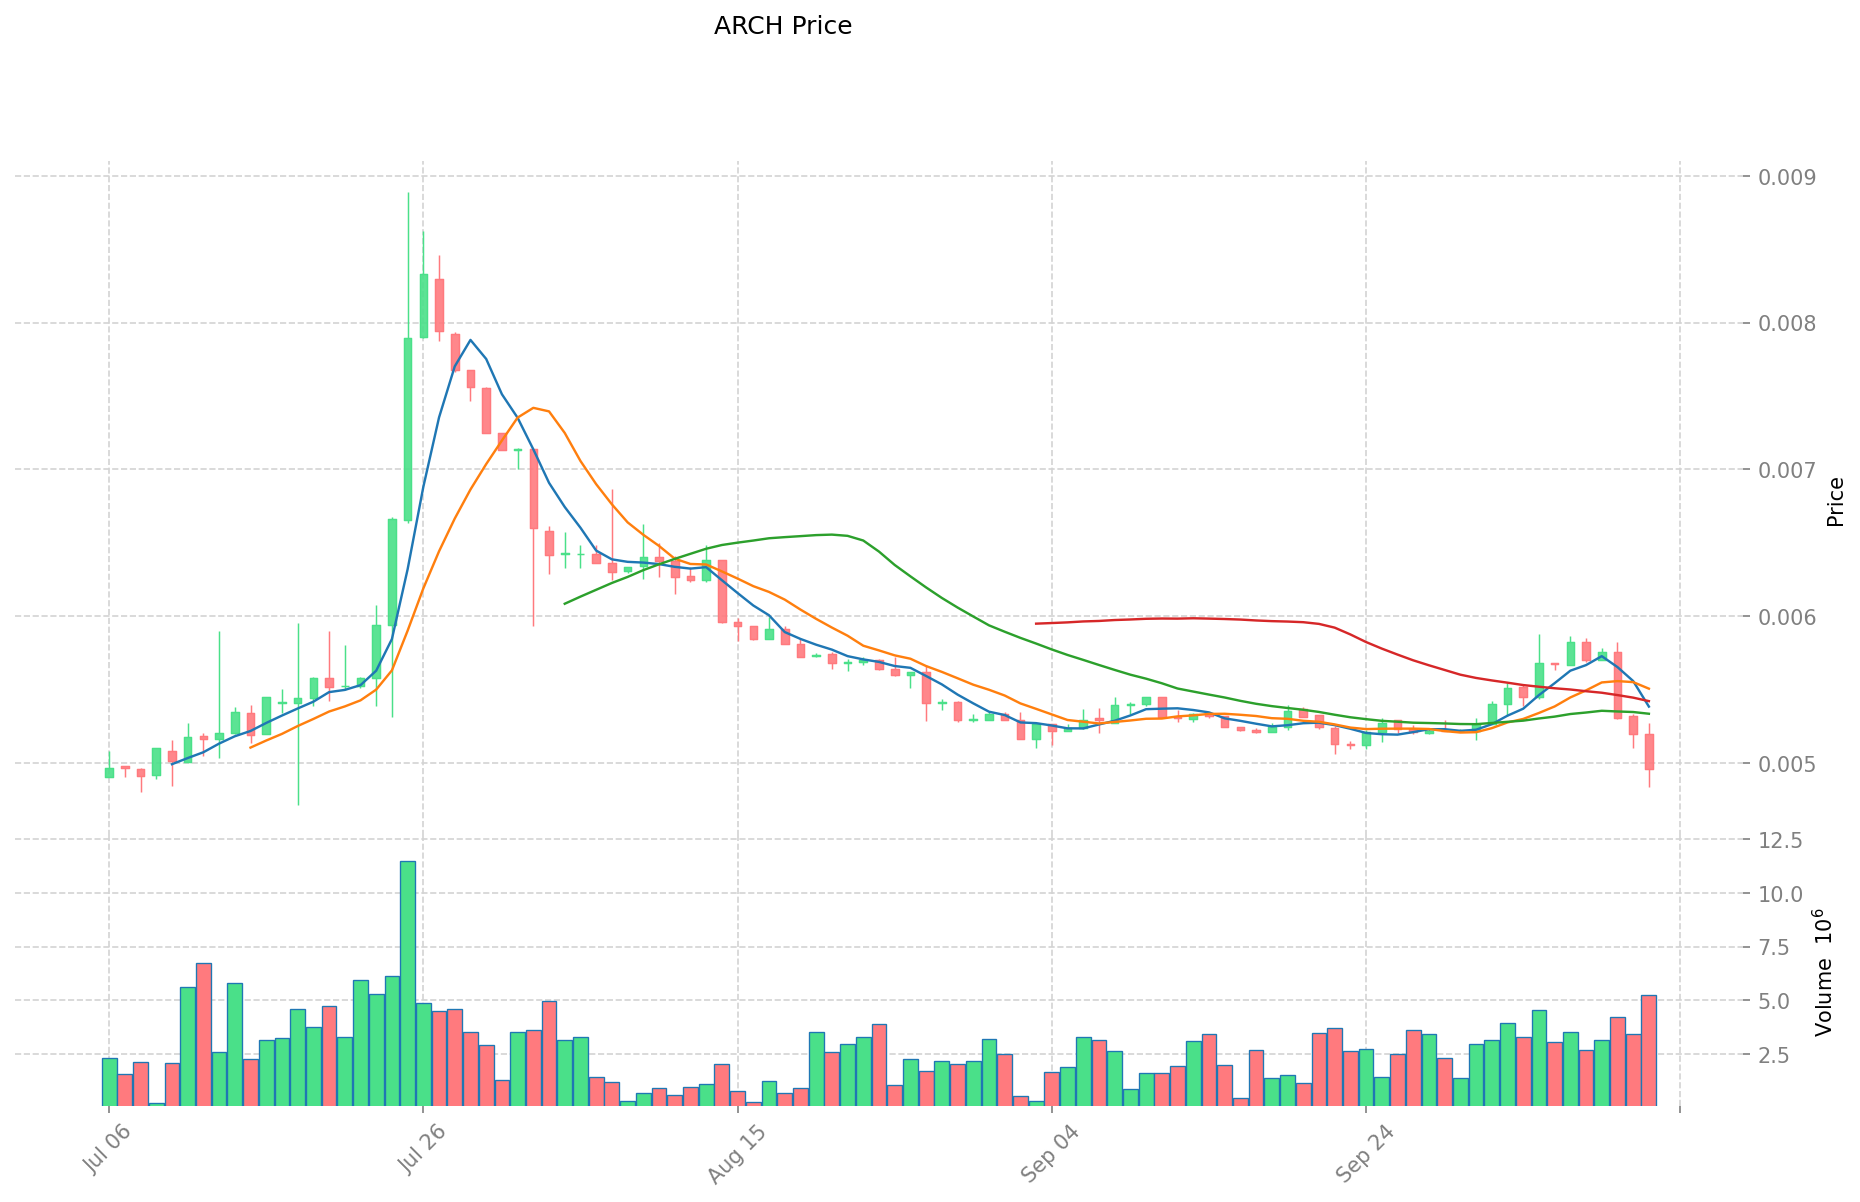
- 2023: ARCH reached its all-time high of $0.28899 on December 24, 2023.
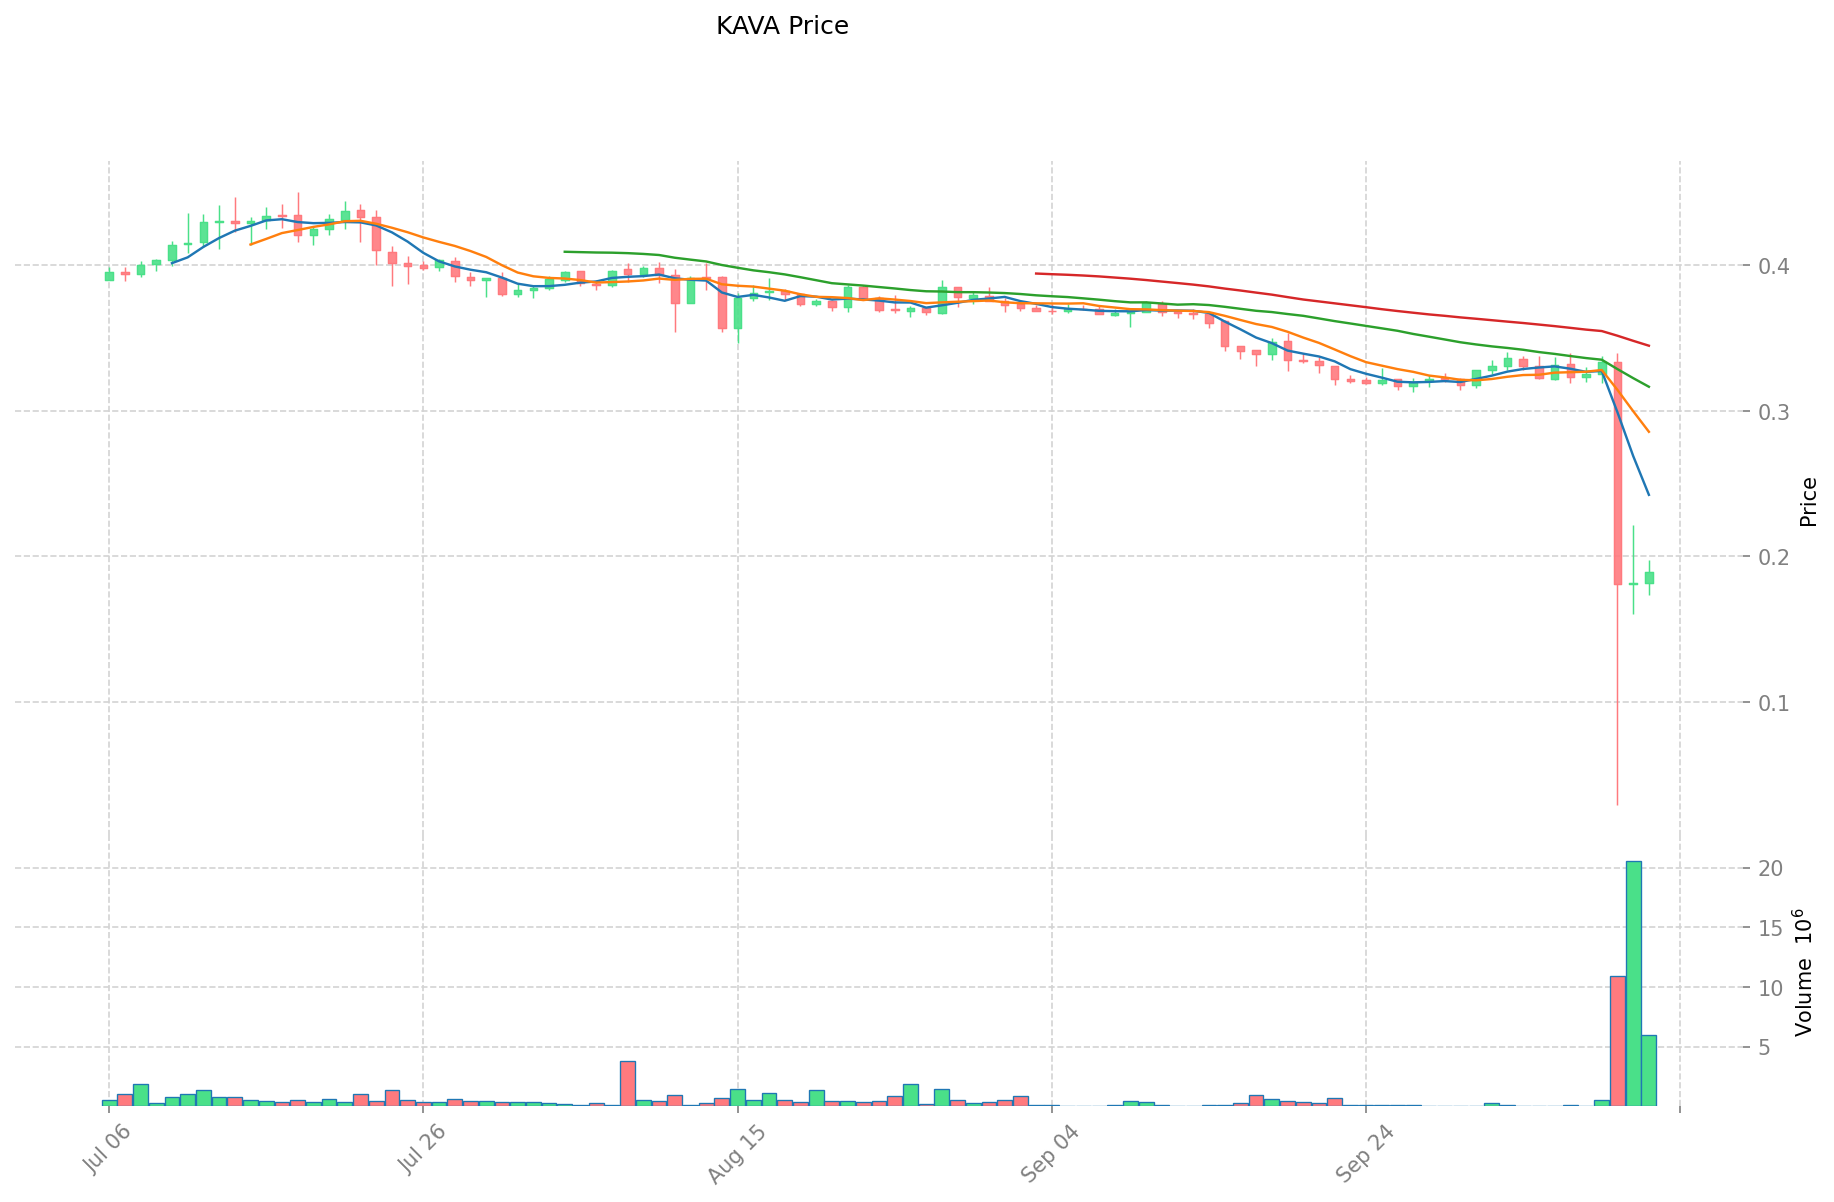
- 2025: KAVA hit its all-time low of $0.138058 on July 18, 2025.
- Comparative analysis: In the recent market cycle, ARCH has fallen from its high of $0.28899 to a current price of $0.004962, while KAVA has dropped from its historical high of $9.12 to $0.1881.
Current Market Situation (2025-10-13)
- ARCH current price: $0.004962
- KAVA current price: $0.1881
- 24-hour trading volume: $26,988.98 (ARCH) vs $1,072,570.73 (KAVA)
- Market Sentiment Index (Fear & Greed Index): 38 (Fear)
Click to view real-time prices:
- View ARCH current price Market Price
- View KAVA current price Market Price
II. Core Factors Affecting ARCH vs KAVA Investment Value
Supply Mechanism Comparison (Tokenomics)
- ARCH: Limited information available regarding supply mechanism
- KAVA: Limited information available regarding supply mechanism
- 📌 Historical Pattern: Insufficient data on how supply mechanisms drive price cycle changes.
Institutional Adoption and Market Application
- Institutional Holdings: Insufficient information on institutional preference between ARCH and KAVA
- Enterprise Adoption: Limited data on applications in cross-border payments, settlements, or investment portfolios
- National Policies: Insufficient information on regulatory attitudes across different countries
Technological Development and Ecosystem Building
- ARCH Technology Upgrades: Insufficient specific information
- KAVA Technology Development: Insufficient specific information
- Ecosystem Comparison: Limited data on DeFi, NFT, payment, and smart contract implementation
Macroeconomic and Market Cycles
- Performance in Inflationary Environments: Insufficient data on anti-inflation properties
- Macroeconomic Monetary Policy: Limited information on how interest rates and USD index affect both tokens
- Geopolitical Factors: Insufficient data on cross-border transaction demands and international situations
III. 2025-2030 Price Prediction: ARCH vs KAVA
Short-term Prediction (2025)
- ARCH: Conservative $0.00382074 - $0.004962 | Optimistic $0.004962 - $0.00709566
- KAVA: Conservative $0.105448 - $0.1883 | Optimistic $0.1883 - $0.203364
Mid-term Prediction (2027)
- ARCH may enter a growth phase, with expected price range of $0.0051519366765 - $0.0065512281195
- KAVA may enter a consolidation phase, with expected price range of $0.135760534 - $0.237005678
- Key drivers: Institutional capital inflow, ETF, ecosystem development
Long-term Prediction (2030)
- ARCH: Base scenario $0.00775085975483 - $0.008758471522958 | Optimistic scenario $0.008758471522958+
- KAVA: Base scenario $0.348929883666 - $0.47803394062242 | Optimistic scenario $0.47803394062242+
View detailed price predictions for ARCH and KAVA
Disclaimer
ARCH:
| 年份 |
预测最高价 |
预测平均价格 |
预测最低价 |
涨跌幅 |
| 2025 |
0.00709566 |
0.004962 |
0.00382074 |
0 |
| 2026 |
0.0066920013 |
0.00602883 |
0.0031952799 |
21 |
| 2027 |
0.0065512281195 |
0.00636041565 |
0.0051519366765 |
28 |
| 2028 |
0.006907729416682 |
0.00645582188475 |
0.004325400662782 |
30 |
| 2029 |
0.008819943858945 |
0.006681775650716 |
0.004677242955501 |
34 |
| 2030 |
0.008758471522958 |
0.00775085975483 |
0.004185464267608 |
56 |
KAVA:
| 年份 |
预测最高价 |
预测平均价格 |
预测最低价 |
涨跌幅 |
| 2025 |
0.203364 |
0.1883 |
0.105448 |
0 |
| 2026 |
0.2643732 |
0.195832 |
0.17037384 |
3 |
| 2027 |
0.237005678 |
0.2301026 |
0.135760534 |
21 |
| 2028 |
0.3269757946 |
0.233554139 |
0.13079031784 |
23 |
| 2029 |
0.417594800532 |
0.2802649668 |
0.241027871448 |
47 |
| 2030 |
0.47803394062242 |
0.348929883666 |
0.31054759646274 |
83 |
IV. Investment Strategy Comparison: ARCH vs KAVA
Long-term vs Short-term Investment Strategy
- ARCH: Suitable for investors focused on smart contract platform potential
- KAVA: Suitable for investors interested in DeFi and cross-chain capabilities
Risk Management and Asset Allocation
- Conservative investors: ARCH: 30% vs KAVA: 70%
- Aggressive investors: ARCH: 60% vs KAVA: 40%
- Hedging tools: Stablecoin allocation, options, cross-currency portfolios
V. Potential Risk Comparison
Market Risk
- ARCH: Higher volatility due to lower market cap and trading volume
- KAVA: Exposure to DeFi market fluctuations
Technical Risk
- ARCH: Scalability, network stability
- KAVA: Cross-chain security, smart contract vulnerabilities
Regulatory Risk
- Global regulatory policies may impact both tokens differently, with potential stricter oversight on DeFi platforms affecting KAVA more directly
VI. Conclusion: Which Is the Better Buy?
📌 Investment Value Summary:
- ARCH advantages: Incentivized smart contract platform, potential for growth
- KAVA advantages: Established presence in DeFi, cross-chain functionality
✅ Investment Advice:
- New investors: Consider a balanced approach with a slight preference for KAVA due to its more established market presence
- Experienced investors: Explore opportunities in both, with a higher allocation to ARCH for potential growth
- Institutional investors: Conduct thorough due diligence on both projects, considering KAVA for its DeFi ecosystem and ARCH for its smart contract incentives
⚠️ Risk Warning: The cryptocurrency market is highly volatile. This article does not constitute investment advice.
None
VII. FAQ
Q1: What are the main differences between ARCH and KAVA?
A: ARCH is an incentivized smart contract platform that rewards developers, while KAVA is a cross-chain decentralized financial platform. ARCH has a lower market cap and trading volume, potentially offering higher growth potential, while KAVA has a more established presence in the DeFi space.
Q2: Which cryptocurrency has performed better historically?
A: Based on the available information, ARCH reached its all-time high of $0.28899 on December 24, 2023, while KAVA hit its all-time low of $0.138058 on July 18, 2025. However, both have experienced significant price declines from their respective highs.
Q3: What are the current prices and market sentiments for ARCH and KAVA?
A: As of October 13, 2025, ARCH's price is $0.004962, and KAVA's price is $0.1881. The market sentiment, as indicated by the Fear & Greed Index, is at 38, suggesting a fearful market environment.
Q4: How do the supply mechanisms of ARCH and KAVA compare?
A: Unfortunately, there is limited information available regarding the supply mechanisms of both ARCH and KAVA. This lack of data makes it difficult to analyze how their tokenomics might drive price changes.
Q5: What are the long-term price predictions for ARCH and KAVA?
A: For 2030, the base scenario predicts ARCH to be in the range of $0.00775085975483 - $0.008758471522958, with an optimistic scenario above $0.008758471522958. For KAVA, the base scenario predicts a range of $0.348929883666 - $0.47803394062242, with an optimistic scenario above $0.47803394062242.
Q6: How should investors allocate their assets between ARCH and KAVA?
A: Conservative investors might consider allocating 30% to ARCH and 70% to KAVA, while aggressive investors might prefer 60% ARCH and 40% KAVA. However, these allocations should be adjusted based on individual risk tolerance and investment goals.
Q7: What are the main risks associated with investing in ARCH and KAVA?
A: Both cryptocurrencies face market risks, with ARCH potentially experiencing higher volatility due to its lower market cap. Technical risks include scalability and network stability for ARCH, and cross-chain security for KAVA. Regulatory risks may impact both, with potentially stricter oversight on DeFi platforms affecting KAVA more directly.
* The information is not intended to be and does not constitute financial advice or any other recommendation of any sort offered or endorsed by Gate.


