This comprehensive guide teaches traders how to master the Hanging Man candlestick pattern for enhanced trading success. The article explores what the Hanging Man is—a bearish reversal pattern characterized by a small body and long lower shadow appearing at uptrend peaks. It covers pattern identification, interpretation techniques, and practical trading strategies on Gate exchange and other platforms. The guide emphasizes combining the Hanging Man with confirmation signals like volume analysis, support/resistance levels, and technical indicators such as RSI and MACD to avoid false signals. Traders learn key advantages including clear reversal signals and easy recognition, alongside disadvantages like context dependency. The article compares the Hanging Man with related patterns like the Hammer and Shooting Star, providing essential risk management tools for cryptocurrency and financial market trading success.
What is the Hanging Man Candlestick?
Navigating the crypto market can often appear complex due to its inherent volatility, where prices can shift in an instant. Consequently, market participants must continuously attempt to predict what will happen next. They accomplish this by utilizing trading signals and technical indicators found in chart patterns. For instance, the Hanging Man pattern serves as a trading signal that market participants use to predict the timing of a market reversal toward a downward trend.
In technical analysis, the Hanging Man candlestick represents a bearish candle pattern that signals an impending trend reversal. This candle tends to appear at the peak of an upward movement in the market, as the candle formation indicates that the uptrend has exhausted its momentum. The pattern is characterized by its distinctive shape: a small real body positioned at the upper end of the trading range, with a long lower shadow that extends downward, demonstrating significant selling pressure during the trading period.
Since the Hanging Man is a type of candlestick, it only appears on candlestick charts. This chart type has gained increasing popularity among traders because it can reveal substantial information about market dynamics, price action, and the psychological battle between buyers and sellers. This is why candlestick patterns have become an integral part of many traders' strategies across various financial markets, particularly in the volatile cryptocurrency space.
What Does the Hanging Man Candlestick Look Like?
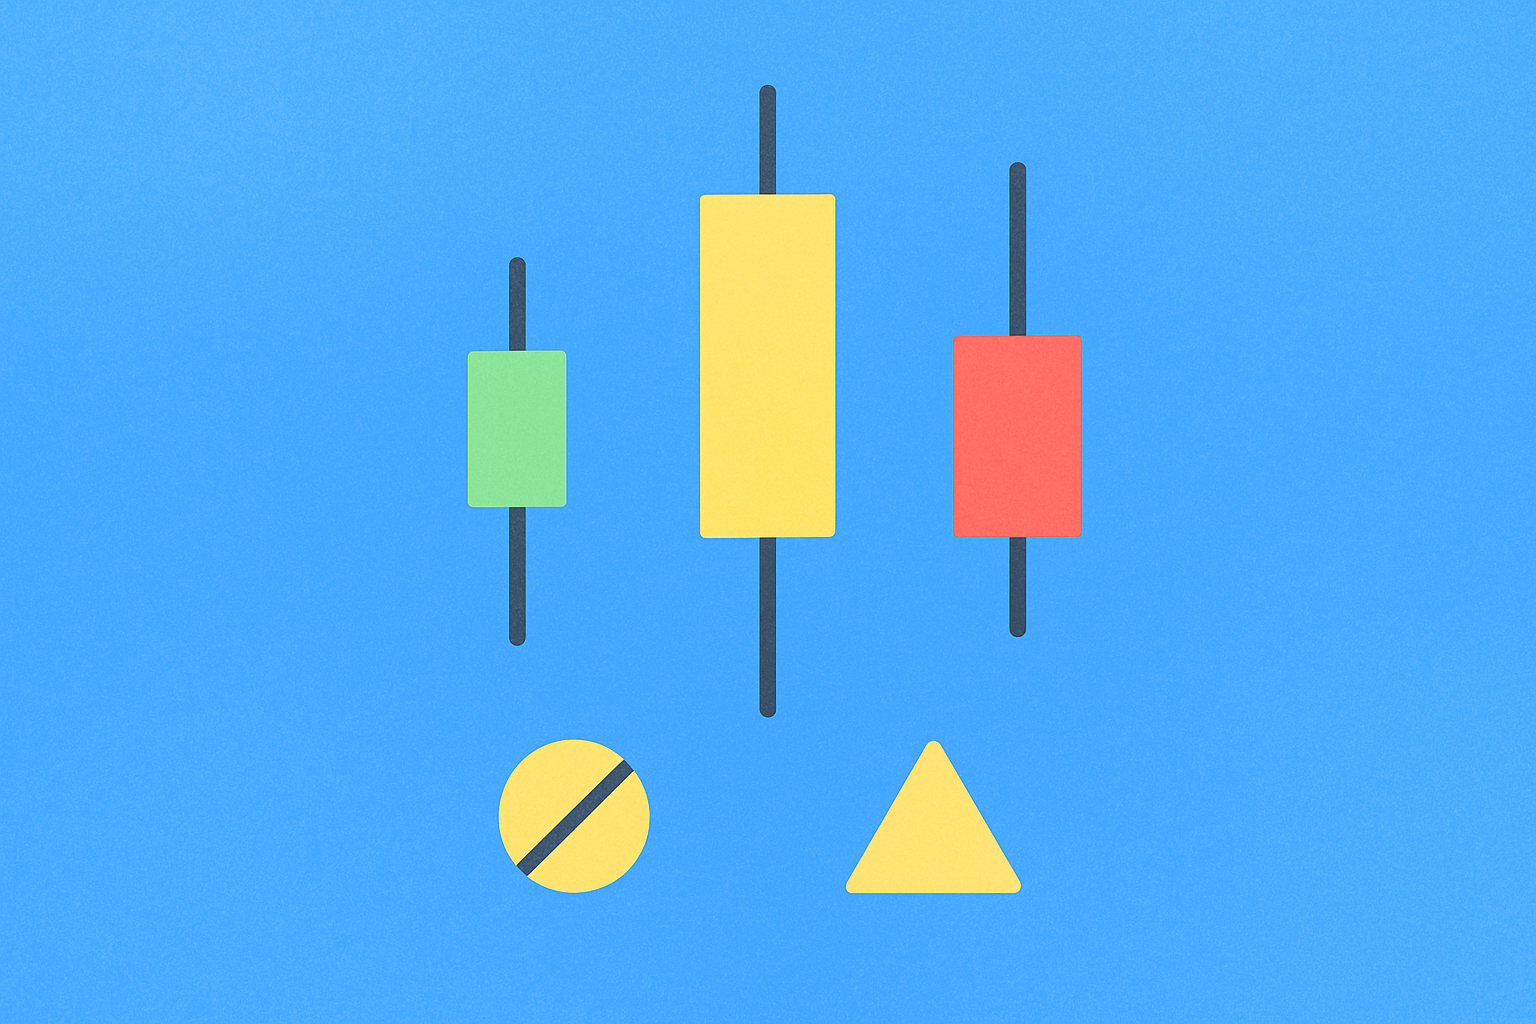
The Hanging Man is essentially the bearish counterpart of the Hammer candlestick pattern. This candle forms when the opening price is positioned above the closing price, creating a specific visual signature that experienced traders can quickly identify. The pattern features a relatively small body located at the upper portion of the candle's range, accompanied by a long lower shadow (or wick) extending downward, which demonstrates that the market experienced strong selling pressure during that trading session.
The long lower shadow indicates that sellers pushed prices significantly lower during the period, but buyers managed to recover some ground before the close, though not enough to close above the opening price. The candle may also display an upper shadow, although this is considerably smaller than the lower shadow, suggesting minimal buying pressure at higher price levels. The ideal Hanging Man pattern has a lower shadow that is at least twice the length of the real body, creating the distinctive "hanging" appearance that gives the pattern its name.
The color of the real body can vary—it may be red (bearish) or green (bullish)—but for a true Hanging Man pattern, the closing price should be near the opening price or slightly below it, positioned in the upper portion of the entire candle's range. This formation tells a story of initial strength followed by significant weakness, with only partial recovery by the close.
How to Interpret the Hanging Man Candlestick Pattern?
Market participants utilize the Hanging Man candlestick to gain insights into future price movements and potential trend changes. The bearish lower shadow indicates intense downward activity and selling pressure during the trading period. However, as mentioned above, the closing price must be lower than the opening price for the pattern to maintain its bearish significance. If the closing price exceeds the opening price, this would transform into a bullish Hammer pattern instead, carrying entirely different implications.
The interpretation process involves understanding the market context in which the Hanging Man appears. When this pattern emerges after an extended uptrend or at a resistance level, it suggests that buyers are losing control and sellers are beginning to assert dominance. The long lower shadow represents a failed attempt by sellers to maintain lower prices, but the fact that the close is near the high indicates that buyers are weakening and may not be able to sustain the upward momentum.
Traders should pay particular attention to the volume accompanying the Hanging Man formation. Higher volume during this candle's formation strengthens the bearish signal, as it indicates more significant participation in the selling pressure. Additionally, the position of the pattern within the broader market structure matters—a Hanging Man appearing at a key resistance level or after a prolonged rally carries more weight than one appearing in the middle of a trading range.
How to Trade with the Hanging Man Candlestick Pattern?
When you identify a Hanging Man candlestick during market analysis, the pattern typically serves as a signal to consider selling or taking profits, as it represents a bearish candle formation that may mark the beginning of a trend reversal. However, prudent traders understand that acting on this signal requires careful consideration and confirmation from additional technical factors.
One crucial principle to remember is never to rely solely on the Hanging Man candlestick in isolation. No single pattern should be used independently when conducting technical analysis, as false signals frequently occur in financial markets. It's possible that buying pressure remains strong overall, but the market experienced a sudden wave of selling during that particular period. This doesn't necessarily mean that buyers have completely lost control or that a significant reversal is imminent.
For this reason, traders should always combine the Hanging Man pattern with other indicators and analytical tools to avoid reacting to false signals. Effective confirmation methods include:
- Waiting for the next candle: A bearish candle following the Hanging Man, especially one that closes below the Hanging Man's low, provides strong confirmation of the reversal signal.
- Volume analysis: Increased volume on the Hanging Man and subsequent bearish candles strengthens the pattern's reliability.
- Support and resistance levels: The pattern carries more significance when it appears at established resistance levels.
- Technical indicators: Tools such as RSI (Relative Strength Index), MACD (Moving Average Convergence Divergence), or moving averages can provide additional confirmation of weakening momentum.
- Multiple timeframe analysis: Checking higher timeframes for confluence with the bearish signal increases confidence in the trade setup.
A conservative trading approach involves waiting for confirmation before entering a short position or closing long positions. This might mean waiting for the candle following the Hanging Man to close bearish, or for the price to break below a key support level, thereby validating the reversal signal suggested by the Hanging Man pattern.
Advantages and Disadvantages of the Hanging Man Candlestick Pattern
As we have examined, the Hanging Man candlestick pattern can prove highly useful as an early warning signal for sudden price changes and potential trend reversals. However, like all analytical tools in the cryptocurrency industry, this pattern possesses both positive and negative aspects. Below is a comprehensive list of advantages and disadvantages to help you better understand its practical application.
Advantages:
- Clear Reversal Signal: The pattern signals a trend reversal from bullish to bearish, alerting traders to changes in market sentiment before a significant downturn occurs. This early warning can help traders protect profits or position themselves for potential short opportunities.
- Easy Recognition: The pattern is straightforward to identify and recognize, thanks to its distinctive characteristics—a small body at the top with a long lower shadow. Even relatively inexperienced traders can learn to spot this formation quickly on price charts.
- Resistance Confirmation: The indicator can confirm that resistance is holding strong when it forms near established resistance levels. This dual confirmation—both from the pattern itself and the resistance level—increases the probability of a successful reversal trade.
- Risk Management Tool: The pattern provides a clear structure for setting stop-loss orders, typically placed slightly above the high of the Hanging Man candle, allowing for defined risk management.
- Psychological Insight: The pattern reveals important information about market psychology, showing that despite strong buying earlier in the session, sellers managed to push prices significantly lower, indicating a shift in sentiment.
Disadvantages:
- False Signals: The Hanging Man can generate false signals for traders, particularly in strongly trending markets. In such situations, traders may take incorrect actions based on the pattern, potentially losing money or missing better opportunities that arise from the trend's continuation.
- Context Dependency: Considering the overall market context before reacting to a Hanging Man pattern is critically important. If this contextual analysis is not performed correctly, market participants can miss potential opportunities or enter trades at inopportune times. The pattern's reliability varies significantly depending on where it appears in the market cycle.
- Subjective Interpretation: The interpretation of this pattern can be somewhat subjective. Different traders may have varying thresholds for determining the strength and relevance of the pattern. What one trader considers a valid Hanging Man, another might dismiss as insignificant based on the length of the shadows or the size of the body.
- Requires Confirmation: The pattern alone is insufficient for making trading decisions, necessitating confirmation from subsequent price action or other technical indicators, which can delay entry and potentially reduce profit potential.
- Market Volatility Impact: In highly volatile markets, the long lower shadow might simply reflect normal price fluctuations rather than a genuine shift in trend, making the pattern less reliable during periods of extreme volatility.
The Hanging Man represents the bearish variant of the Hammer candlestick family. Hammer patterns can manifest in several forms, with some being bullish while others are bearish. Understanding these distinctions is essential for accurate technical analysis. Here's how to differentiate between them:
The Hammer Candlestick
The traditional Hammer candlestick forms when the closing price is positioned above the opening price, creating a visual appearance similar to the Hanging Man. However, despite the presence of strong selling pressure indicated by the long lower shadow, this pattern signals that buyers still maintain control of the market. Consequently, it serves as a bullish signal, typically appearing at the bottom of downtrends.
The key distinction lies in the market context: while both patterns share similar physical characteristics (small body at the top, long lower shadow), the Hammer appears after a downtrend and suggests a bullish reversal, whereas the Hanging Man appears after an uptrend and suggests a bearish reversal. The Inverted Hammer can also form as another bullish signal variant, featuring a small body at the bottom with a long upper shadow, indicating that buyers are testing higher prices and may soon gain control.
The Shooting Star Candlestick
The Shooting Star represents another type of bearish signal in candlestick analysis. Similar in concept to an Inverted Hammer, the Shooting Star carries strongly bearish implications. This pattern announces the potential arrival of a price decline and forms when the opening price is positioned above the closing price, accompanied by a long upper shadow that extends significantly above the small real body.
The Shooting Star appears at the top of uptrends, much like the Hanging Man, but tells a different story: buyers pushed prices significantly higher during the session, but sellers overwhelmed them and drove prices back down by the close. This pattern demonstrates that buyers attempted to extend the rally but failed, suggesting exhaustion of bullish momentum. The long upper shadow should be at least twice the length of the real body, with little to no lower shadow, creating the appearance of a "shooting star" falling from the sky.
Both the Hanging Man and Shooting Star serve as bearish reversal patterns when they appear after uptrends, but they differ in their internal structure and the specific market dynamics they represent. The Hanging Man shows selling pressure during the session with recovery, while the Shooting Star shows initial buying enthusiasm that completely failed by the close.
Why Should You Pay Attention to the Hanging Man Candlestick?
The Hanging Man candlestick functions as an essential tool for technical analysis in cryptocurrency and other financial markets. It proves particularly valuable in identifying potential bearish reversals and solid resistance levels that may halt upward price movements. The pattern's distinctive visual characteristics make it relatively easy to spot on charts, even for traders with moderate experience in technical analysis.
However, traders must remain aware of several important limitations. False signals represent a primary danger when using this pattern, requiring traders to exercise caution and discipline in their approach. The cryptocurrency market's inherent volatility can sometimes produce Hanging Man formations that don't lead to actual reversals, particularly during strong trending periods or when significant news events drive price action.
Additionally, traders should never rely solely on this signal or assume that its appearance guarantees a trend reversal. In the cryptocurrency industry, market dynamics are complex and multifaceted, influenced by numerous factors including regulatory developments, technological advancements, market sentiment, and macroeconomic conditions. The Hanging Man serves as one piece of evidence suggesting potential weakness, but it must be evaluated within the broader context of market structure and confirmed by additional technical or fundamental analysis.
The pattern's value lies in its ability to alert traders to potential changes in market dynamics, prompting them to reassess their positions and risk management strategies. When a Hanging Man appears after an extended rally, it suggests that the balance between buyers and sellers may be shifting, warranting closer monitoring of subsequent price action. Traders who incorporate this pattern into a comprehensive trading strategy, combined with proper risk management and multiple forms of analysis, can enhance their ability to identify high-probability trading opportunities while avoiding costly false signals.
Ultimately, the Hanging Man candlestick represents a useful tool in the technical analyst's arsenal, but like all analytical tools, its effectiveness depends on proper application, confirmation, and integration into a well-rounded trading approach that considers multiple timeframes, indicators, and market conditions.
FAQ
The Hanging Man is a bearish reversal pattern forming in uptrends with a small body and long lower wick. It signals potential trend reversal when price rises then pulls back sharply, leaving a long lower shadow. Appears at uptrend peaks.
How to identify and confirm key characteristics of the hammer candlestick pattern?
A hammer candlestick features a small real body positioned at the top, a long lower shadow, and minimal or no upper shadow. Confirm the bullish reversal signal when the next candlestick closes above the hammer's high, ideally with increased trading volume.
What trading signal does the Hammer pattern represent, and how might price move?
The Hammer pattern signals a potential bottom reversal, suggesting prices may reverse upward. It indicates buying pressure after a decline. Use it with other technical indicators to confirm trading decisions.
What is the difference between the Hammer and the Inverted Hammer pattern?
The Hammer forms at low prices and signals potential upward reversal, while the Inverted Hammer appears at high prices and indicates potential downward reversal. Both are trend reversal patterns requiring confirmation from subsequent price action.
How to use the hammer pattern for buying and selling decisions and risk management in actual trading?
The hammer pattern signals bullish reversal when price consolidates near lows then closes higher. Enter long positions on confirmation of upward momentum in following candles. Set stop-loss below the hammer's low to limit downside risk. Combine with volume confirmation and resistance levels for stronger signals.
How reliable is the hanging man pattern and which other technical indicators should be combined to confirm it?
The hanging man pattern's reliability improves significantly when combined with volume confirmation and price action analysis. Verify signals using RSI, MACD, and support/resistance levels. Higher trading volume strengthens the pattern's credibility for potential reversals.
* The information is not intended to be and does not constitute financial advice or any other recommendation of any sort offered or endorsed by Gate.