Summary
-
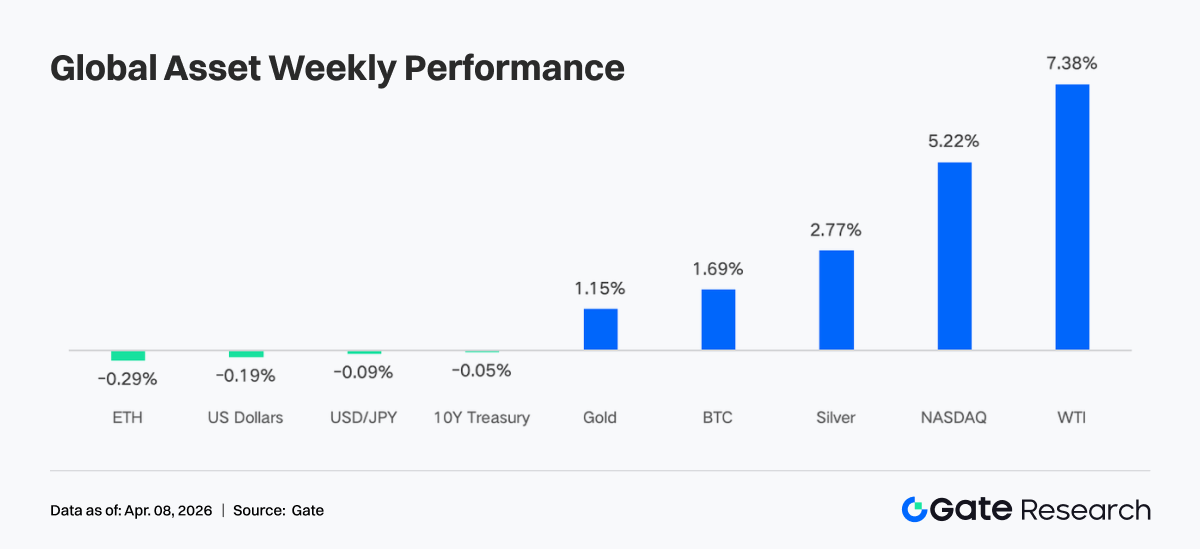
Over the past week, the market was jointly driven by recurring geopolitical conflict expectations and stronger than expected economic data. Statements from the United States and Iran repeatedly shifted between a possible ceasefire and continued military strikes, driving sharp swings in oil prices, with WTI up more than 7% on the week. At the same time, retail sales, ISM, and nonfarm payrolls all came in above expectations. Stronger economic resilience fueled a sharp rebound in equities, while gold and silver continued to hit new highs amid rising inflation expectations and safe haven demand.
-
On the flow side, the market showed low amplitude fluctuations alongside structural disruptions. BTC ETFs recorded modest weekly net inflows of about $22.3 million, a clear improvement from the previous week but still limited in scale, while ETH ETFs continued to see net outflows. Quarter end rebalancing combined with holiday effects created a V shaped pattern from late March to early April, with inflows followed by rapid outflows. Overall, this suggests that institutional allocation pace remains dominated by macro and mechanical factors.
-
On chain and trading structures became more concentrated in high volatility assets. TradFi trading volume on Perp DEXs and CEXs tilted clearly toward crude oil and precious metals. Energy products gained a much larger share, while precious metals remained at elevated levels. DEX rankings were reshuffled, with Meteora posting a sharp rise in volume and moving into first place. Liquidity concentrated further in a small number of highly efficient protocols, while divergence emerged within the Solana ecosystem.
-
Stablecoin and DeFi structures continued to adjust. Total stablecoin supply stayed elevated in a high range. USDT was broadly flat, while USDC edged lower. More capital flowed into DeFi native stablecoins. In liquid staking, Lido and Rocket Pool on Ethereum rebounded, while Solana LSTs remained under adjustment. Aave lending volume recovered overall, with both the core market and sub chains improving in tandem.
-
Protocol revenue structure returned to a more normal pattern. Stablecoin issuers remained the main source of revenue. Trading platform revenue declined from the prior week, while wallet and frontend entry points such as Pump, Phantom, and Jupiter saw higher revenue, reflecting a return of capital toward traffic distribution channels.
-
The derivatives market moved into a neutral range. BTC funding rates recovered to around zero, while open interest surged and then fell back to around $21 billion. Options positioning shifted toward shorter expiries, put demand rose, Skew remained in negative territory, and DVOL stayed elevated in a volatile range, indicating that the market is mainly pricing short term uncertainty.
Market Focus
On Monday, reports said that the United States and Iran were discussing a possible 45 day ceasefire agreement along with terms to reopen the Strait of Hormuz. The news triggered a strong market rebound. Dow futures jumped 1,100 points overnight, and Brent crude briefly fell below $100 for the first time since early March. However, on Wednesday evening, Trump said strikes on Iran would continue for another “two to three weeks,” abruptly reversing market optimism. Oil prices then surged above $113, with WTI posting a weekly gain of more than 7%.
Recent economic data showed continued resilience in the economy. Retail sales and the ISM manufacturing index released last week both exceeded expectations, indicating that consumer spending remains healthy and manufacturing is still expanding. Friday’s nonfarm payrolls and unemployment rate both improved, with monthly payroll growth reaching its highest level since December 2024. This eased market concerns about an economic recession and pushed the Nasdaq sharply higher, marking its best weekly performance since November 2025. Amid rising inflation expectations and safe haven demand, gold and silver continued to make new highs, while cautious remarks from Fed officials kept the dollar index rangebound at elevated levels. The Treasury market was pulled between strong labor data and inflation concerns, leaving 10-year Treasury futures only slightly changed.
Crypto joined the risk appetite trade, with Bitcoin approaching the $70,000 level that has acted as resistance for weeks, while Ethereum broke above $2,100. After four consecutive months of outflows, spot Bitcoin ETFs posted $1.32 billion in net inflows in March.
Liquidity Analysis
Net Flows into Crypto ETFs
Last week, BTC ETF daily flows showed a pronounced V shaped swing. Net inflows reached $117.6 million on March 31, the strongest single day at month end, before sharply reversing to negative $173.7 million on the first trading day of April. BTC ETFs posted weekly net inflows of about $22.3 million, while Ethereum ETFs saw weekly net outflows of $42.2 million. Compared with the previous week, when BTC ETFs recorded $296 million in net outflows, last week marked a clear improvement. However, in absolute terms, it was still the smallest positive week in recent months, suggesting sentiment remained cautious rather than optimistic.
Top BTC ETF products by net inflow:
-
ARKB (ARK 21Shares): weekly net inflow of $34.2 million
-
IBIT (BlackRock): weekly net inflow of $16.4 million
Top ETH ETF products by net inflow:
-
ETHB (BlackRock staked ETH ETF): weekly net inflow of $10.7 million
-
ETH mini: weekly net inflow of $6.5 million
The largest outflow came from ETHA (BlackRock) at negative $64.0 million, followed by FETH (Fidelity) at negative $7.3 million.
March 31 marked the end of Q1, and passive institutional rebalancing was concentrated at quarter end. If Bitcoin outperformed stocks and bonds in Q1, allocation models would automatically trim overweight positions. This explains why inflows over the last two days of March were followed by a sharp outflow on April 1. It was a mechanical and expected adjustment rather than a bearish signal. On April 3, ahead of the Good Friday long weekend, both CME futures and ETF creation and redemption mechanisms were paused, removing the anchor for institutional buying. In addition, economic data reduced expectations for rate cuts, putting further pressure on risk assets, while ETF flows also began to show signs of slowing in early April.
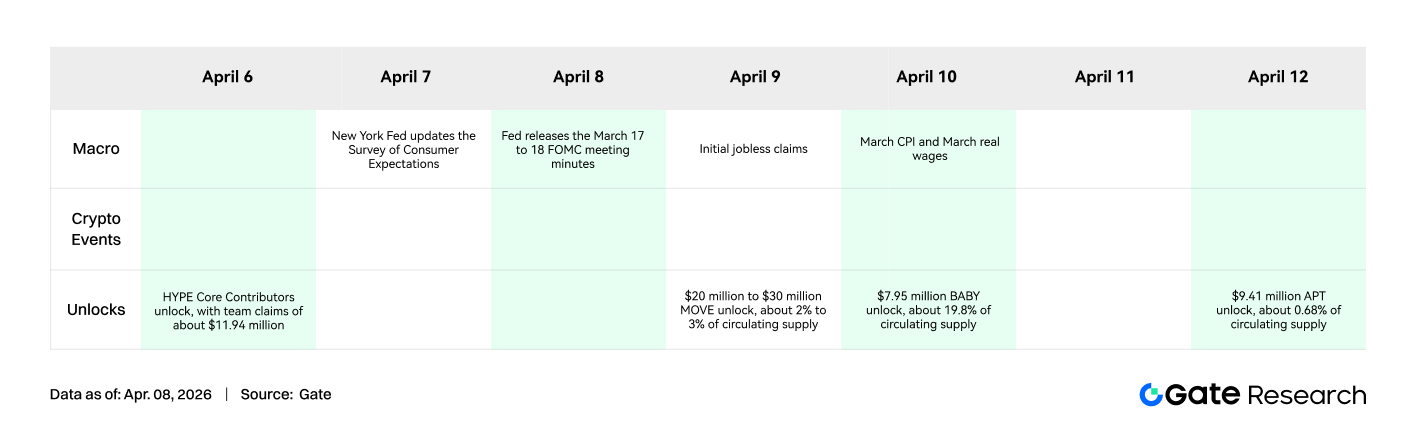
The next key catalyst is the April 9 CPI release, which will directly influence how the market reprices the timing of rate cuts. ETF flow direction may become clearer at that point.
TradFi Liquidity
Over the past week, TradFi trading volume on Perp DEXs showed a clear structural reallocation. Energy products, represented by CL and Brent oil, saw a significant rise in share and became the dominant theme. This was mainly driven by higher oil prices and geopolitical risk, with increased short term volatility attracting concentrated trading flows. At the same time, precious metals such as XAU and XAG remained at relatively high levels but edged lower in share, indicating that safe haven demand was still present, although marginal trading interest was diverted toward energy. The share of single stocks such as NVDA continued to shrink, showing that in a macro dominated phase, individual equity assets became less attractive for trading.
On CEXs, TradFi trading volume expanded at elevated levels but remained highly concentrated in commodities. Precious metals, especially XAU and XAG, continued to be the absolute core source of trading activity, maintaining a dominant share over time. On some platforms, gold and silver together contributed more than 70% of TradFi trading volume, serving as the main liquidity anchor. Energy products, including crude oil CL and Brent, also saw a notable increase in both volume and share during the week. Driven by the rapid rise in oil prices and broader volatility, daily turnover in crude oil perpetual contracts reached several hundred million dollars, quickly making them core trading instruments and reflecting capital preference for high volatility and macro beta.
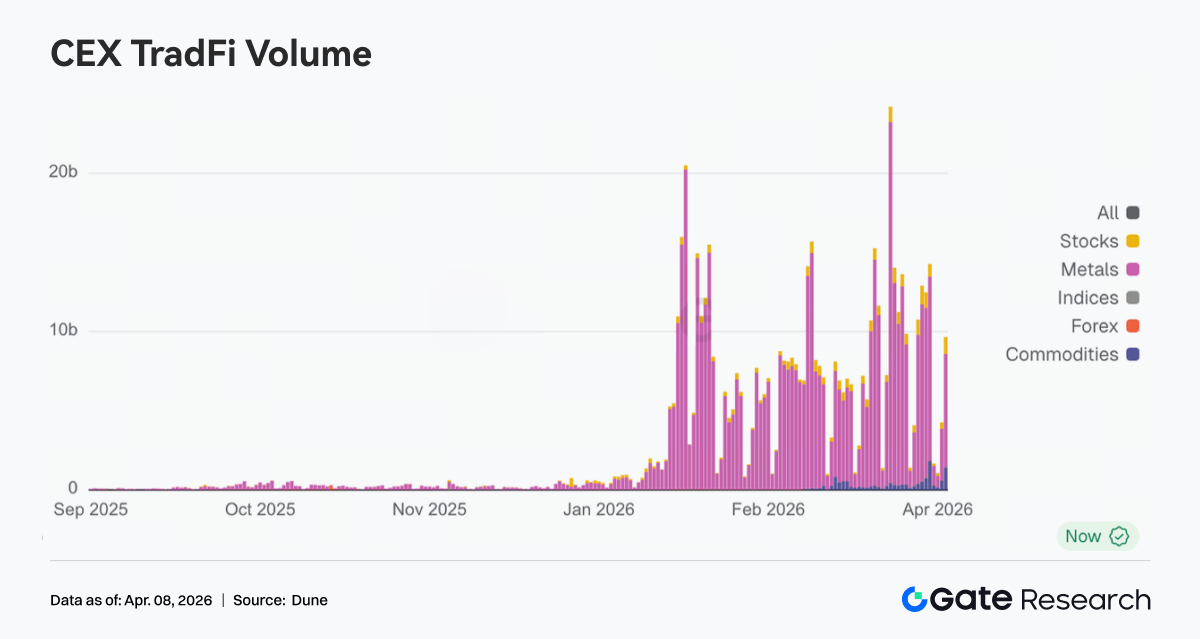
The number of TradFi asset categories expanded further over the past week. Across three major CEXs, the total number of TradFi asset categories, counting only TradFi and CFD sections and excluding perpetual contracts, rose from 678 to 802, up 18.3% week over week. Among them, stocks saw the fastest growth, increasing from 379 to 487, up 28.5%, while stock indices ranked second, rising from 69 to 81, up 17.4%.
We selected XAUT, the highest volume TradFi asset, and analyzed its order book depth Delta. Last week displayed a typical pattern of rising prices, persistent net selling pressure, and then a phased recovery, reflecting that capital was primarily taking profits at higher levels.
-
Uptrend phase: depth turned negative, with sustained selling pressure. From March 31 to April 2, XAUT prices rose rapidly, corresponding to stronger gold prices, but order book depth turned clearly negative, with multiple large negative Delta readings. This suggests that active sell orders, whether for profit taking or hedging, continued to cap the market during the rally. In other words, the move was not driven by aggressive buying but was instead a distribution phase of rising prices and exiting positions. This is consistent with gold’s role as a safe haven asset, where rallies are often accompanied by profit taking.
-
High level and consolidation phase: negative Delta peaked, with liquidity passively absorbing flows. Around April 1, extreme negative Delta readings close to negative $2 million appeared near the local price high, indicating concentrated profit taking or short hedging by large capital, while buyers were mostly passive liquidity providers. Delta then gradually turned positive and showed multiple upward pulses, suggesting some capital began buying the dip, although bullish conviction had not fully recovered.
On Chain Data Insights
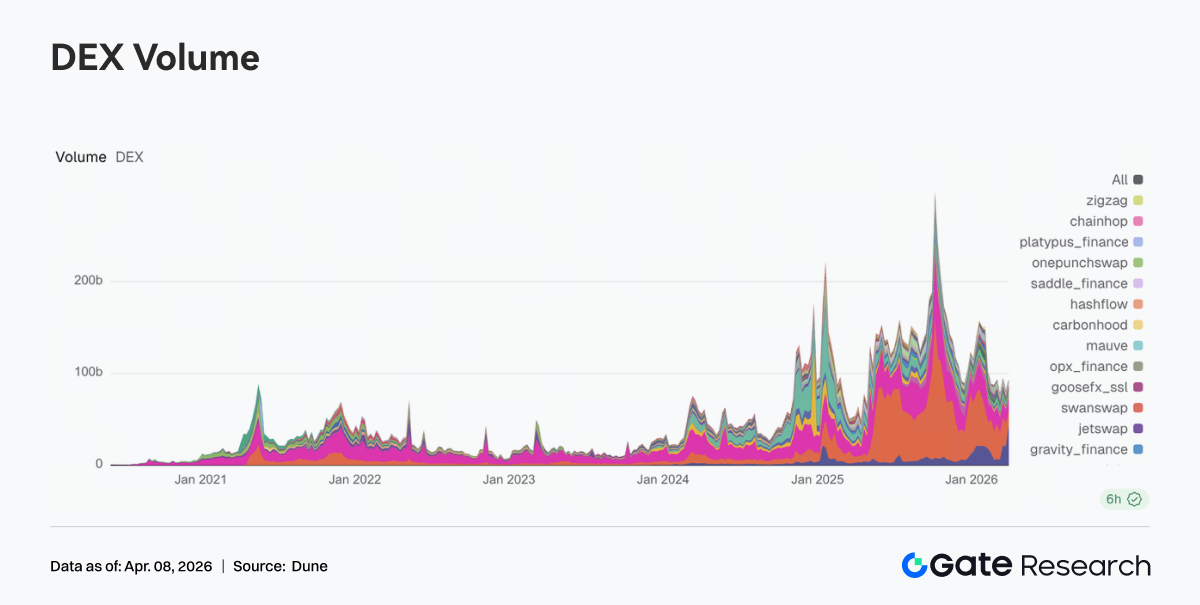
Solana Trading Flows Concentrate Further in Meteora as DEX Rankings Are Reshaped
Last week, the DEX structure underwent a significant reshuffle. Meteora’s trading volume rose to $43.215 billion from $20.631 billion the prior week, surging into first place. Mechanically, Meteora’s DLMM model benefits more from high volatility conditions and active market making demand. PancakeSwap fell from $25.185 billion to $15.640 billion, while Uniswap edged down to $13.100 billion. Overall, major spot platforms failed to keep pace with the latest wave of traffic expansion on Solana. Divergence also emerged within the Solana ecosystem. Raydium fell from $2.390 billion to $1.384 billion, while Whirlpool rose to $1.968 billion and Pumpswap increased from $343 million to $471 million. Overall, last week’s pricing clearly favored trading elasticity and liquidity capture, with liquidity concentrating in a small number of highly efficient entry points.
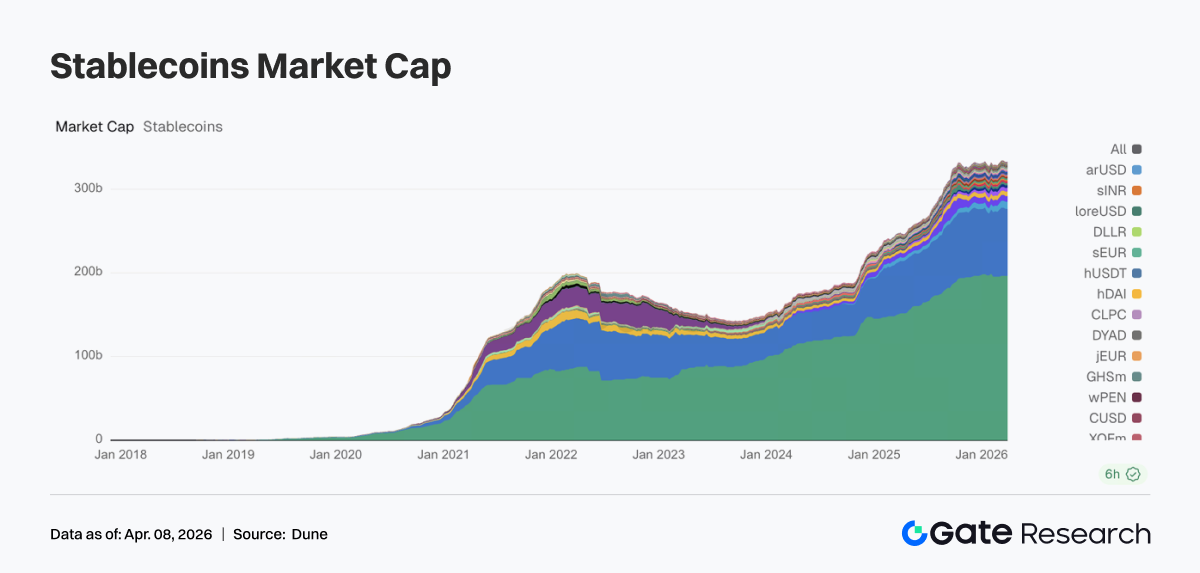
Total Stablecoin Supply Remains Elevated as Incremental Flows Concentrate in Core DeFi Assets
Last week, the stablecoin market remained rangebound at elevated levels. USDT was broadly flat, while USDC edged lower, extending the slower growth trend seen since mid March. Capital tilted toward DeFi native stablecoins. USDS rose from $8.405 billion to $8.695 billion, while DAI increased from $5.213 billion to $5.461 billion, making them the main recipients of incremental flows last week. PYUSD recovered slightly to $3.170 billion, while USDT0 declined to $2.485 billion, reflecting capital diversion between payment rails and cross chain mapped assets. Overall, on chain capital last week showed a stronger preference for stablecoin assets that can participate directly in DeFi.
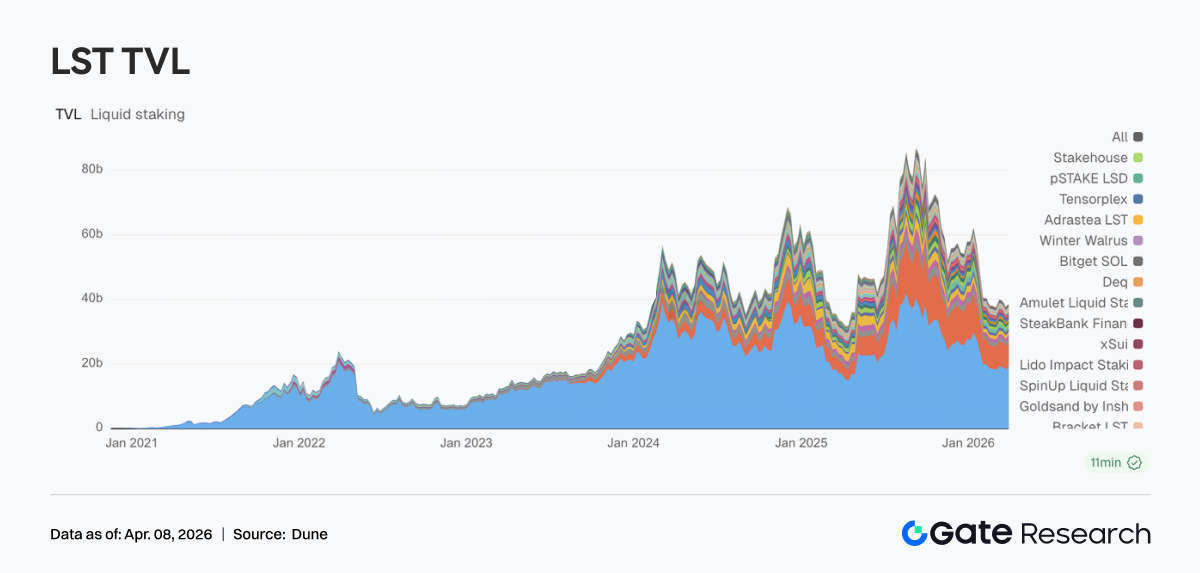
Liquid Staking Returns to the ETH Core Theme While the SOL Ecosystem Remains in Internal Adjustment
The liquid staking sector showed divergence last week. On the ETH side, the overall trend recovered, with Lido rebounding from $18.329 billion to $19.193 billion and Rocket Pool recovering to $1.192 billion, largely reclaiming the prior week’s pullback. By contrast, Solana LSTs continued to adjust. Jito declined from $1.021 billion to $906 million, while Jupiter Staked SOL and Kinetiq also moved lower. At the product level, Lido continued advancing institutional yield tools such as EarnETH and EarnUSD, gradually improving its yield framework, while the Solana side remained in a phase of structural selection.
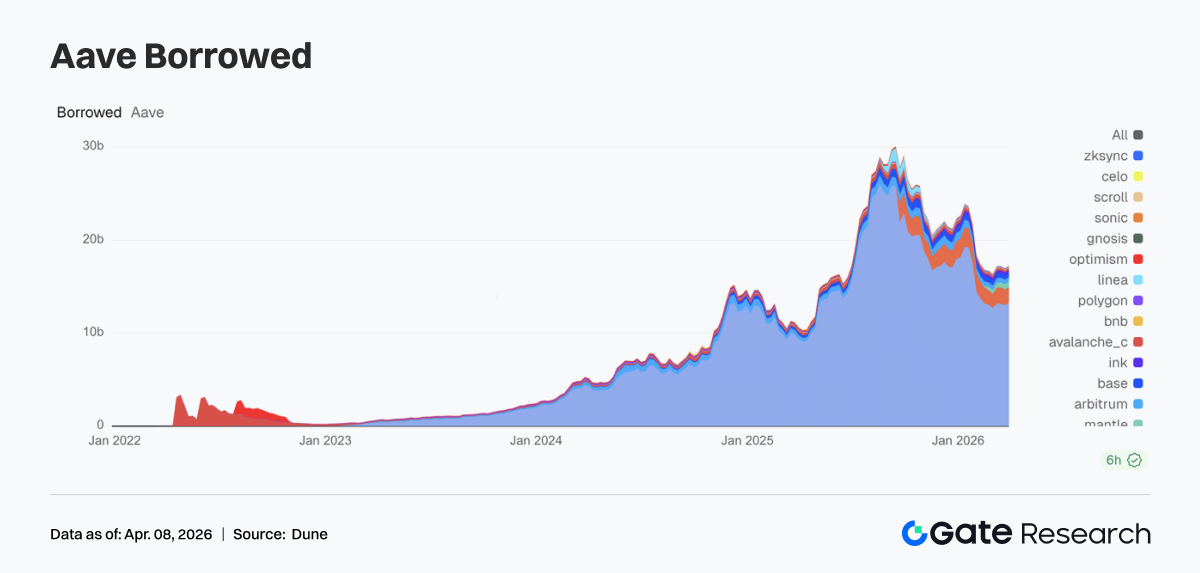
Aave Lending Recovers as Core Markets and Sub Chains Improve in Tandem
Last week, Aave lending volume ended its pullback and resumed growth. The Ethereum core market rose from $13.050 billion to $13.266 billion, providing the main support for the broader recovery. Sub chain markets also improved in tandem, with Mantle rising to $591 million, Base recovering to $496 million, and Arbitrum edging up to $498 million. Plasma remained elevated at $1.664 billion, showing that high yield or new use case markets still have strong capital. Combined with Aave’s ongoing V4 Hub and Spoke architecture rollout, this rebound resembles a rebuilding of leveraged positions ahead of future cross market liquidity integration.
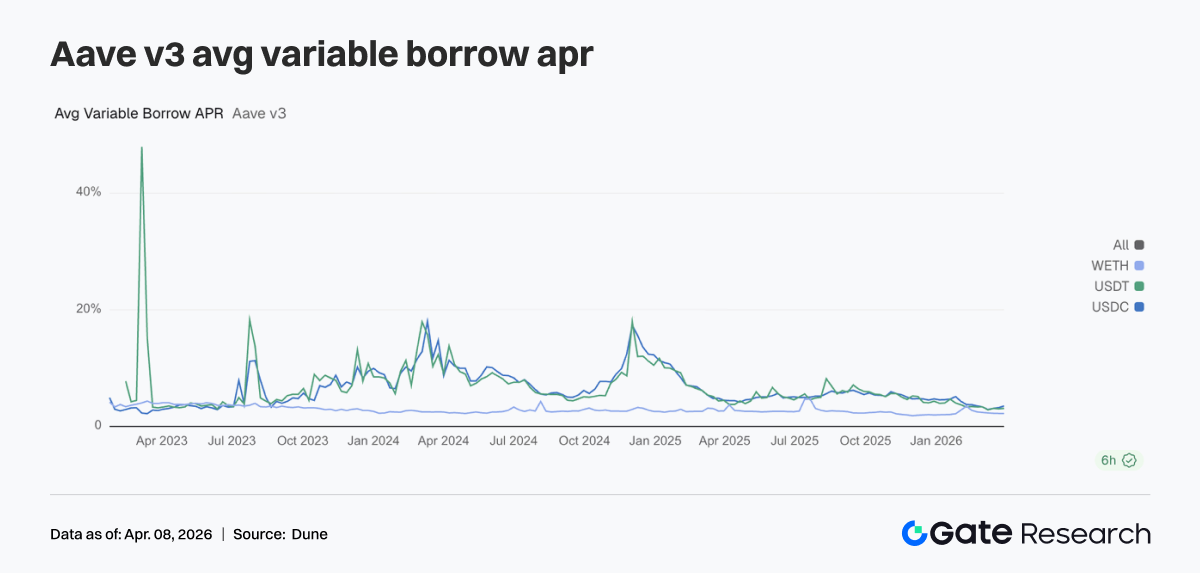
Rate Divergence Intensifies as USDC Funding Costs Rise Significantly
Aave’s lending rates for its three core assets diverged further last week. USDC borrowing APR rose from 3.23% to 3.51%, marking the most notable increase. USDT edged up to 3.10%, while WETH stayed broadly stable around 2.23%. Although lending volume recovered, capital mainly flowed into stablecoin borrowing rather than ETH loans, meaning ETH borrowing demand did not strengthen in tandem. Market behavior leaned more toward capital allocation, arbitrage, and position rolling than directional leverage expansion. Under expectations for the V4 architecture, funding price dispersion across assets may widen further. Last week’s rise in USDC rates already reflected this trend in advance.
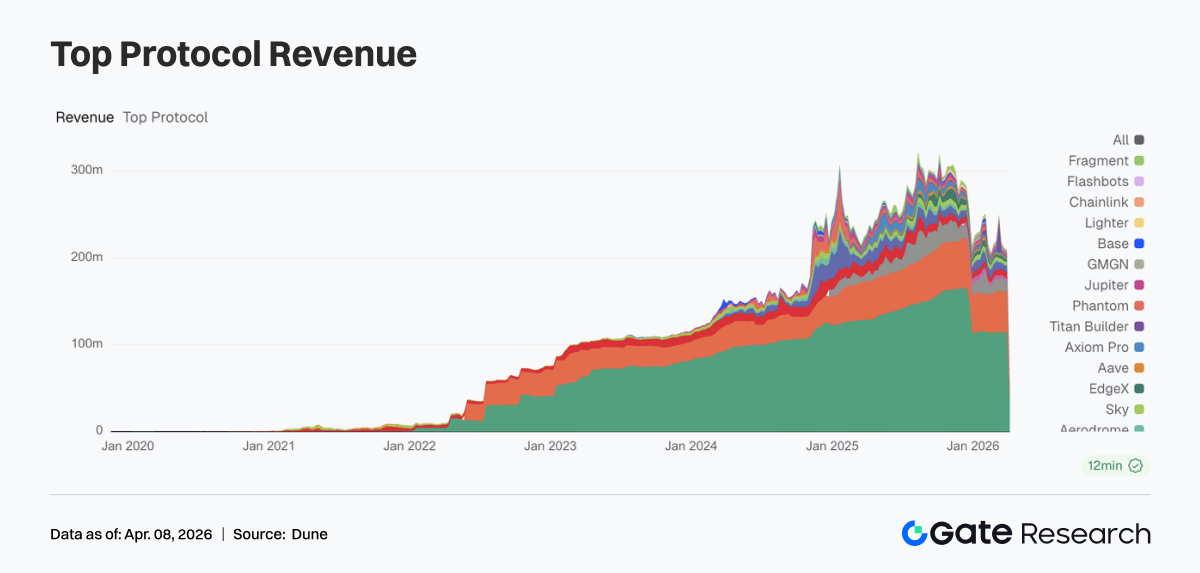
Protocol Revenue Returns to Fundamentals as Stablecoins and Traffic Gateways Provide Dual Support
Last week, protocol revenue structure returned to a more normal pattern. Tether generated $114.29 million in revenue, while Circle recorded $46.6868 million, showing that stablecoin issuance remained the most resilient source of revenue. Trading platform revenue declined, with both Hyperliquid and EdgeX lower than the previous week, indicating that trading elasticity moderated on a temporary basis. At the same time, traffic gateways began to strengthen, with Pump, Phantom, and Jupiter all posting revenue growth as capital flowed back toward wallets and frontend distribution channels. Overall, revenue structure showed a pattern of stablecoin issuers providing a floor, stronger traffic gateways, and divergence among trading platforms.
Derivatives Tracking
BTC Funding Rates Recover from Negative Levels and the Market Enters a Neutral Trading Phase
Last week, BTC funding rates continued to recover, rising gradually from sustained negative levels to around zero and briefly turning positive midweek. This indicated a shift from a defensive, bear dominated market toward a more balanced long short structure. At the start of the week, funding rates were still slightly negative, reflecting weak risk appetite. As prices stabilized and rebounded, funding rates tightened quickly, driven by short covering and arbitrage capital. By the weekend, rates were largely fluctuating narrowly around zero, with no significant leverage expansion, and capital behavior was dominated by short cycle rolling and strategy trading. Overall, last week’s move in funding rates was a rebalancing after sentiment washout. The market has entered a neutral zone, but no clear trend signal has emerged yet.
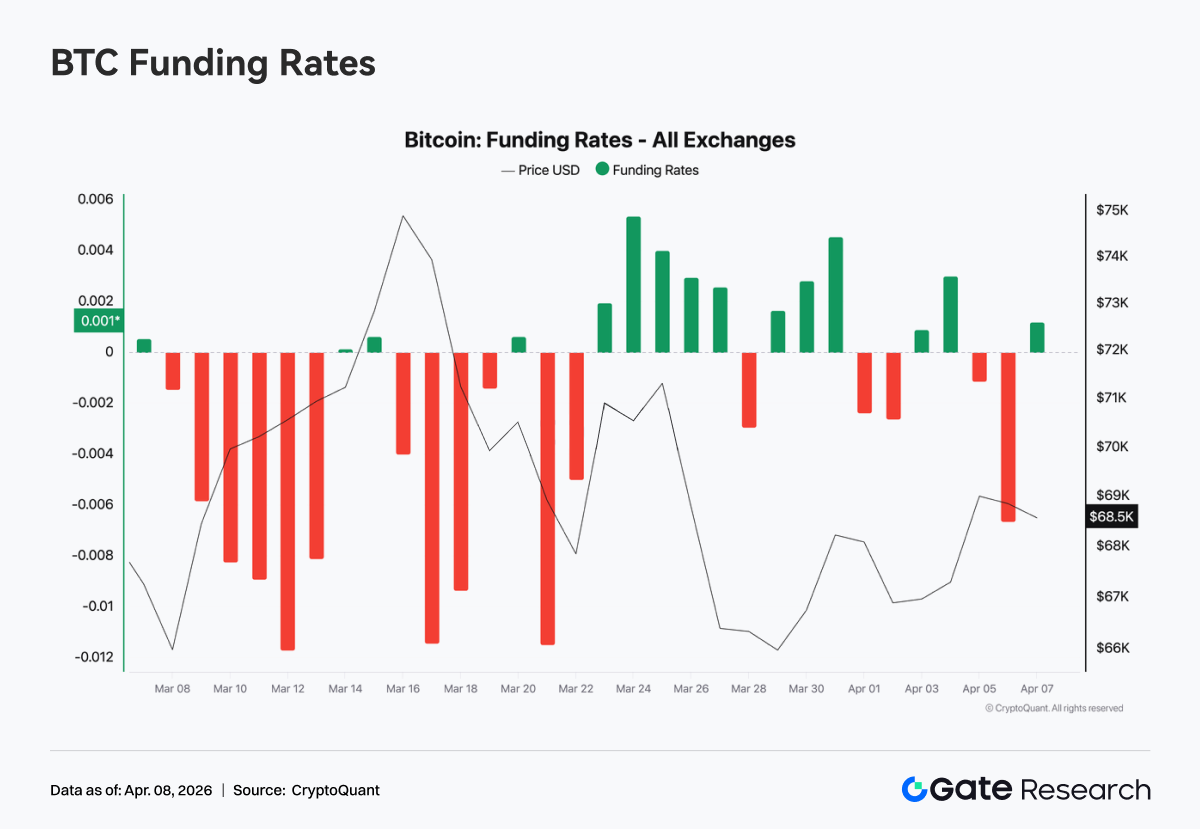
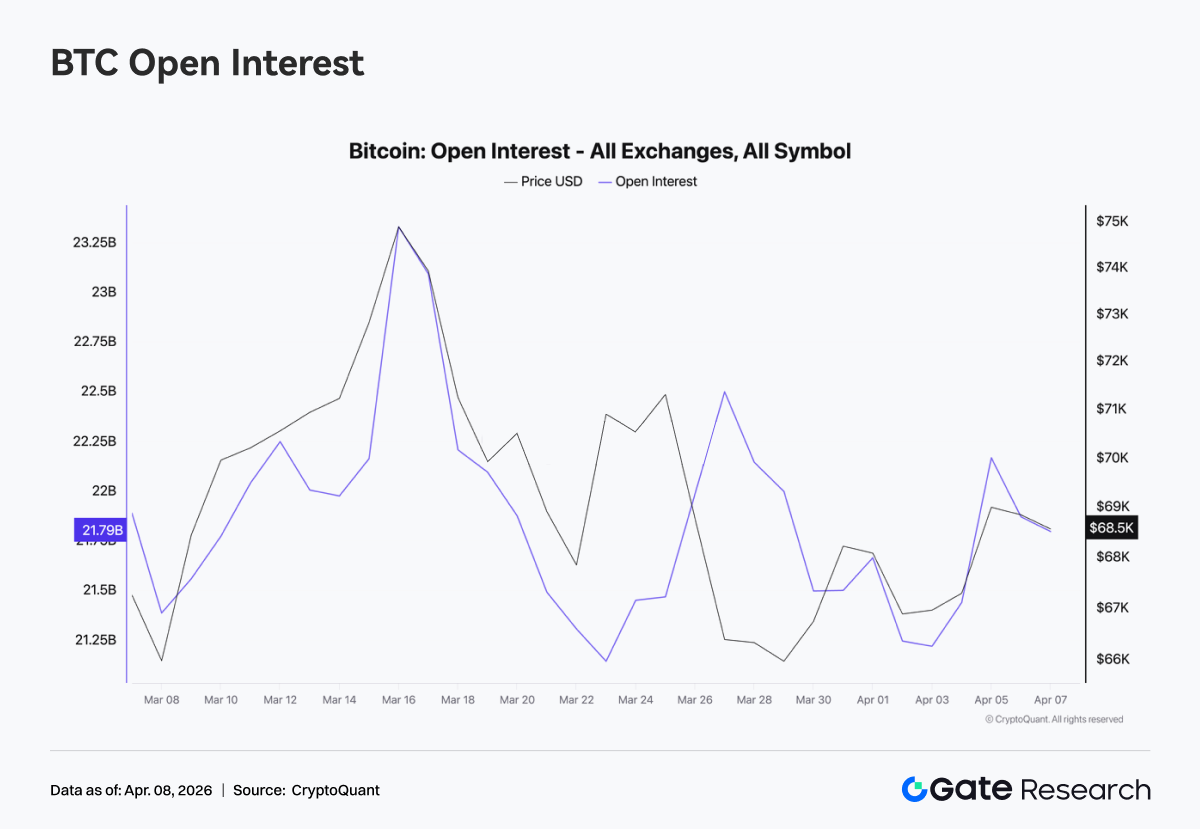
BTC Open Interest Surges and Then Pulls Back as Leverage Momentum Fades
Last week, BTC open interest first rose sharply and then pulled back. It briefly climbed to around $23 billion in the middle of the week before quickly falling back to about $21 billion, followed by only a modest recovery without making new highs. During the price rally, open interest expanded alongside the move, indicating fresh leveraged positions entering the market. But as prices pulled back from higher levels, open interest declined significantly, suggesting that some positions were actively closed or passively liquidated. Open interest failed to hold at elevated levels, leverage expansion was interrupted, and this aligns with funding rates returning to neutral, suggesting the market is near a position rotation phase within a rangebound environment.
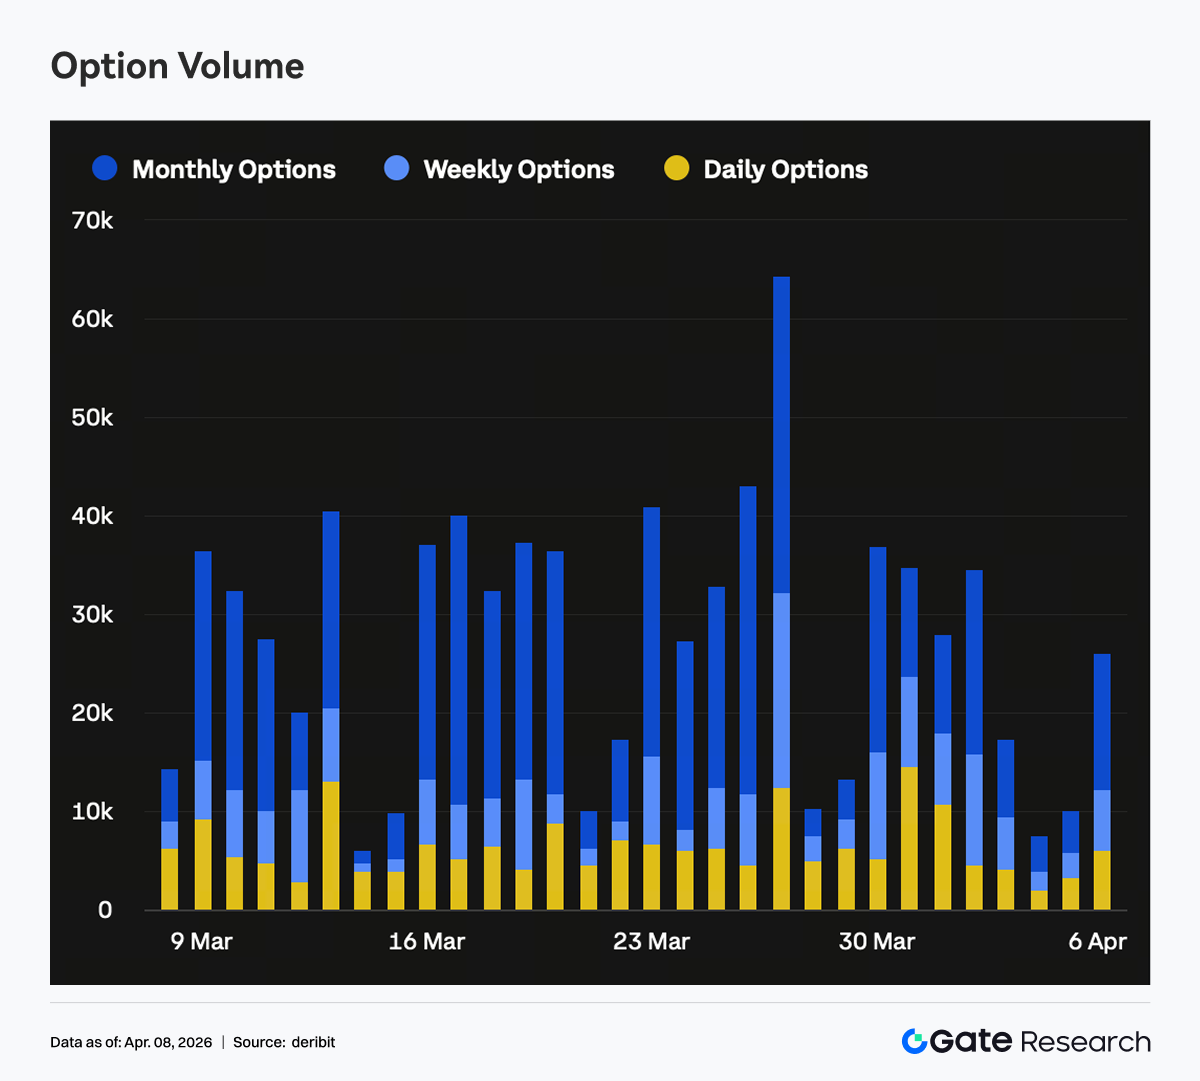
Options Open Interest Did Not Expand and Positioning Shifted Toward the Short End
Last week, the overall size of the options market did not increase meaningfully, indicating limited new capital entering the space and leaving the market dominated by adjustments in existing positions. The share of short dated open interest rose, while medium and long dated positions, especially monthly and further out maturities, declined. This was consistent with the sharp contraction in monthly options trading volume, suggesting that institutions were actively reducing medium term directional exposure at this stage. From a directional perspective, the share of put open interest increased noticeably at the short end. Combined with Skew remaining in negative territory, this indicates that protective demand was mainly concentrated in near term expiry structures. This kind of positioning usually reflects a combination of short term defense and medium to long term wait and see behavior.
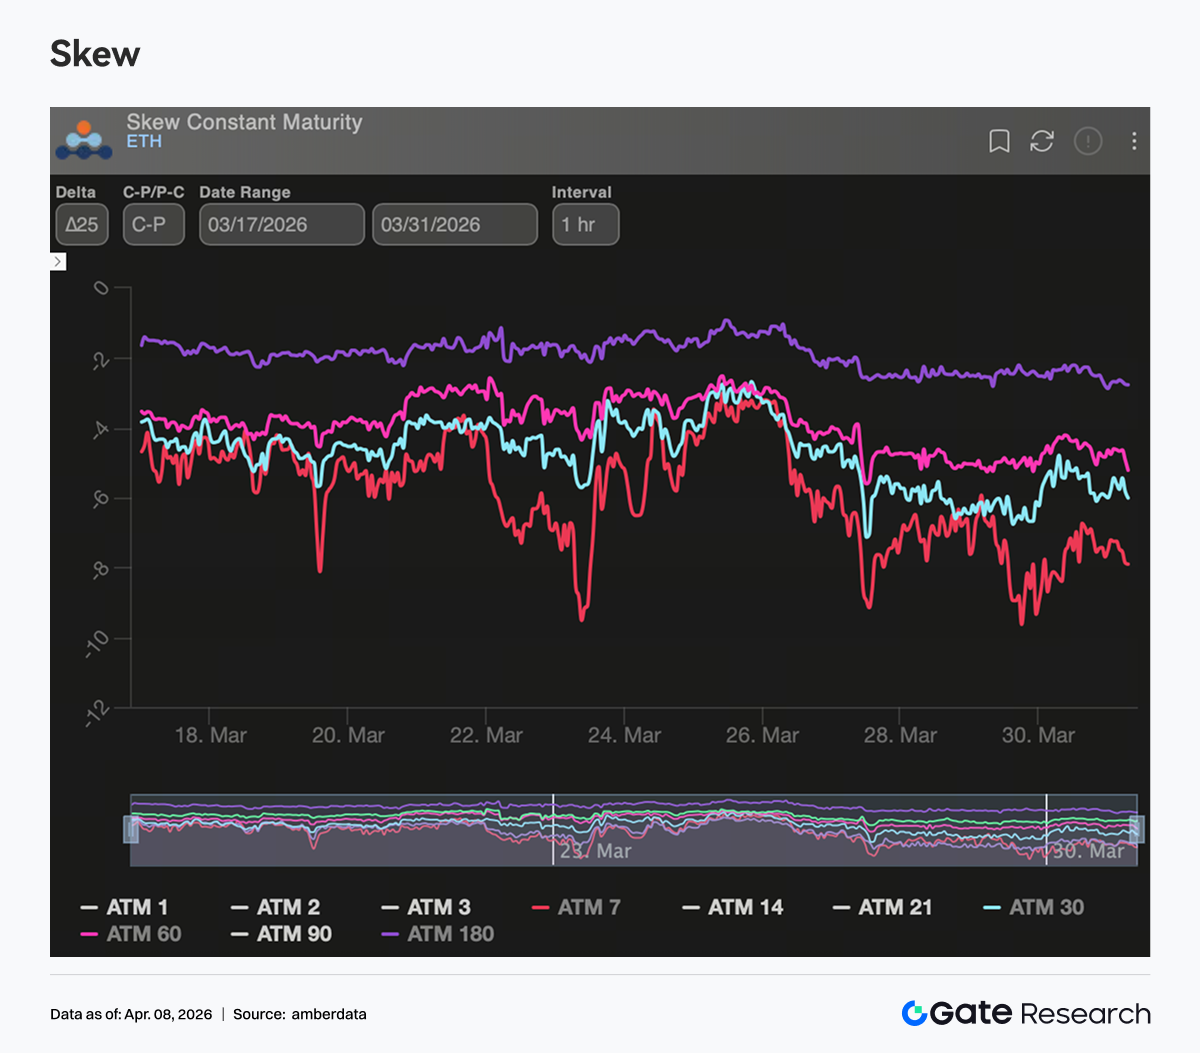
Short End Skew Weakens Again as Protective Demand Reemerges
Last week, Skew remained in negative territory overall, around negative 6 to negative 10, with a structure defined by weakness at the short end and stability at the long end. From late March to early April, 7D and 30D Skew briefly fell to around negative 12. Although it later recovered somewhat, it never returned above neutral and is now holding around negative 7 to negative 8, showing a clear rise in short term protection demand. At the same time, long dated Skew changed little and remained relatively stable, meaning the market has not formed a broadly bearish consensus on the medium to long term outlook. The market is currently pricing mainly short term uncertainty, with continued buying of short dated puts corresponding to event driven hedging or risk management ahead of expiry points.
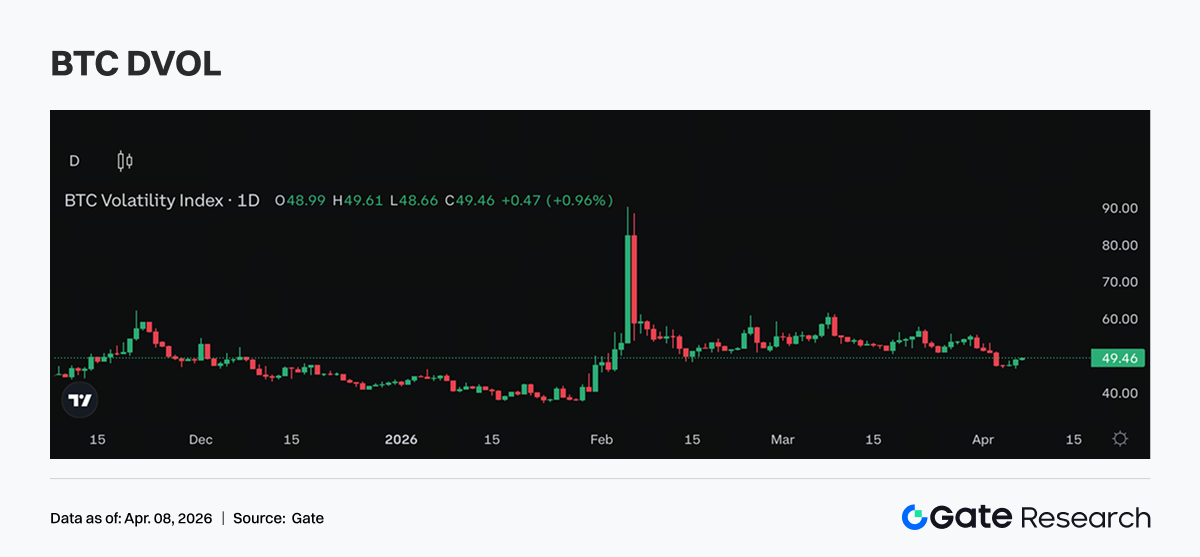
DVOL Remains Elevated in a Range as Volatility Expectations Fail to Move Higher
Last week, DVOL remained rangebound at relatively elevated levels and did not show a clear upside breakout. BTC DVOL stayed around the 40% to 50% range, while ETH DVOL remained near 60% to 70%, extending the consolidation seen after the previous rise. The fact that DVOL did not move higher suggests that the market has not further strengthened its expectations for even greater volatility, meaning short term risk premium is still present but not accelerating. Combined with Skew and options trading structure, current volatility pricing is being driven more by short-dated protection demand. Overall, DVOL reflects a market that has accepted the presence of high volatility, but has not yet started to price a further expansion in volatility.
Outlook for the Week
Gate Institutional Business Update
Market share and institutional participation both improved
-
Gate’s market share in major spot trading pairs continued to rise in Q1, making it the only platform in the industry to achieve growth
-
Institutional trading share increased significantly among leading exchanges, with spot and derivatives shares rising 18% and 45% respectively on a week over week basis
Trading and funding performance continued to improve
-
Trading volume rebounded clearly in the first week of April, with spot and derivatives outperforming the market on a phase basis
-
Funding business continued to expand, with lending volume rising steadily. At the same time, Gate Institutional is exploring a net interest margin model, further stimulating funding demand
Product breakthroughs and technology upgrades
-
The CrossEx ecosystem is taking shape at a faster pace. In Q2, OTC Loan and asset management will be integrated further to unlock synergies
-
In Q2, the team will place greater focus on large clients and latency issues, with a dedicated optimization mechanism to be established
-
Low latency performance has continued to improve, and a future 3.0 architecture upgrade is planned for launch
Sources:
Gate Research is a comprehensive blockchain and cryptocurrency research platform that provides deep content for readers, including technical analysis, market insights, industry research, trend forecasting, and macroeconomic policy analysis.
Disclaimer
Investing in cryptocurrency markets involves high risk. Users are advised to conduct their own research and fully understand the nature of the assets and products before making any investment decisions. Gate is not responsible for any losses or damages arising from such decisions.


