Summary
-
Over the past week, markets were jointly driven by easing geopolitical tensions, cooling inflation, and stable policy expectations. Oil prices fell sharply, the VIX declined, and risk appetite rebounded, pushing BTC into a higher range of $68,000 to $73,000.
-
Capital flows showed a strong recovery after prior volatility. Bitcoin ETFs recorded approximately $833 million in net inflows for the week, marking a new phase high, while Ethereum ETFs also saw net inflows, indicating a return of institutional buying dominance.
-
Market structure shifted toward macro-sensitive, high-volatility assets and leading platforms. Capital concentrated in energy commodities such as crude oil, while on-chain activity rotated back to high-liquidity venues like Uniswap.
-
Stablecoins and DeFi exhibited a structural recovery. USDC emerged as the primary source of incremental liquidity, with capital flowing back into leading staking protocols and major lending markets.
-
Protocol revenue trends indicate a reallocation toward the infrastructure layer, with trading and settlement protocols gaining strength, while front-end distribution channels and traffic-driven platforms cooled.
-
Derivatives markets showed a divergence between positioning and price action. Short positioning became crowded even as prices moved higher, with negative funding rates alongside rising prices suggesting short squeeze potential. Options activity shifted toward short-term trading and volatility-selling strategies.
1. Market Focus Analysis
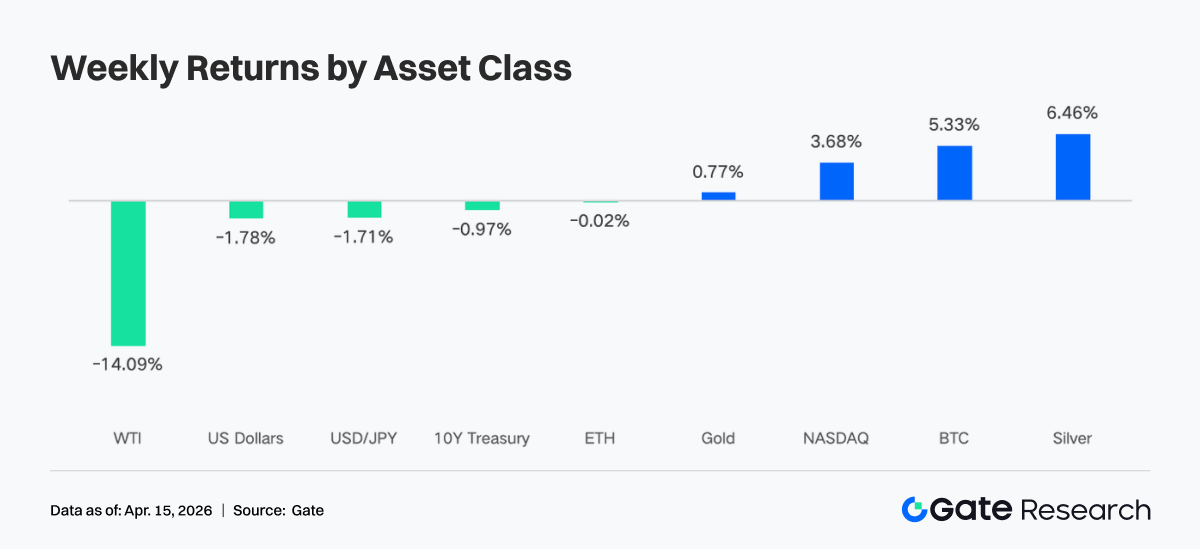
Over the past week, a two-week ceasefire agreement between the United States, Iran, and Israel brought a welcome de-escalation to a conflict that had shaken global markets. Following the announcement, markets staged a strong rebound, with equities and bonds moving higher while oil prices dropped sharply by 14%. The VIX fell to 19.23, marking its first close below 20 since early March.
At the same time, global financial markets, particularly the crypto sector, were significantly influenced by macroeconomic data and expectations around Federal Reserve policy. On April 10, CPI data came in below expectations, signaling easing inflationary pressure and alleviating concerns that the Fed might adopt a more aggressive tightening stance. This is typically seen as supportive for risk assets. In addition, the minutes from the Federal Open Market Committee (FOMC) meeting were released last week, with market pricing indicating a 98.4% probability that rates will remain unchanged in April. This strong consensus around a “wait-and-see” stance has provided a stable policy backdrop and reduced short-term uncertainty.
With inflation pressures easing and policy expectations stabilizing, overall market risk appetite has rebounded meaningfully. Institutional interest in crypto remains strong, as evidenced by continued inflows into spot Bitcoin ETFs, which are providing a solid foundation for the market. These macro drivers have collectively underpinned the performance of Bitcoin and Ethereum over the past week, enabling a swift rebound following a brief pullback.
Over the past two weeks, Bitcoin’s trading range has gradually shifted higher, expanding from $63,000–$70,000 to $68,000–$73,000. The $73,000 level remains a key resistance to watch. A confirmed reopening of the Strait of Hormuz could act as a catalyst for a breakout above this level. On the downside, Bitcoin has repeatedly found support in the $68,000–$69,000 range, although each test has slightly weakened that support band. The market has largely priced in expectations of a prolonged conflict, with crypto currently trading near range support. This suggests that any positive surprise or further de-escalation could drive upside, while additional deterioration appears to be largely absorbed by current pricing.
2. Liquidity Analysis
1. BTC ETFs Record the Strongest Weekly Inflows in Months
Over the past week, BTC ETF flows were highly volatile on a daily basis. On April 6, net inflows reached $471.4 million, marking the largest single-day inflow since late February. However, as geopolitical risks escalated sharply over the following two sessions, flows reversed into net outflows of $159.1 million and $93.9 million, respectively. Despite this turbulence, BTC ETFs recorded total weekly net inflows of approximately $833.2 million, while ETH ETFs saw net inflows of $187.0 million.
On a week-over-week basis, this represents a dramatic improvement compared to the prior week’s roughly $22.3 million in BTC ETF inflows, making it the strongest positive week in months. Market sentiment shifted rapidly between risk aversion and dip-buying, ultimately with bullish positioning regaining dominance.
Top BTC ETF inflows by product:
-
IBIT (BlackRock): $612.1 million weekly net inflow
-
FBTC (Fidelity): $151.7 million weekly net inflow
Top ETH ETF inflows by product:
-
ETHA (BlackRock): $168.3 million weekly net inflow
-
ETHB (BlackRock staking ETH ETF): $66.0 million weekly net inflow
On April 6, institutional buyers stepped in aggressively amid geopolitical uncertainty, driving the outsized inflow. However, as U.S.–Iran negotiations broke down on April 7 and risks around a potential closure of the Strait of Hormuz intensified, risk-off sentiment spread quickly, triggering two consecutive days of capital outflows. This should be viewed as mechanical de-risking in response to sudden war risk, rather than a structural bearish shift.
By the evening of April 8, Donald Trump announced a two-week ceasefire agreement between the U.S. and Iran, sending oil prices sharply lower and easing liquidity concerns. Institutional demand returned aggressively. In addition, March CPI data released on April 10 showed that while headline inflation rose to 3.3% due to energy effects, core CPI came in at 2.6% year-over-year, below expectations. This confirmed that underlying inflation remains contained, further supporting the rebound in risk assets. ETF flows consequently exhibited a “post-bad-news acceleration” pattern, with capital re-entering after uncertainties were priced in.
2. TradFi Liquidity
On the DEX side, TradFi perpetual trading showed a clear structural divergence over the past week, with trading activity shifting decisively toward energy assets. WTI crude oil saw a significant increase in share, becoming the dominant trading instrument. This reflects a market environment where heightened geopolitical risks and oil price volatility have driven capital toward macro-sensitive assets for directional trading. Brent crude also gained share, reinforcing the dominance of the energy sector.
In contrast, traditional safe-haven assets such as gold and silver saw a decline in share, suggesting a rotation away from defensive positioning toward higher-beta opportunities. Equity indices such as XYZ100 and single names like NVDA maintained moderate participation, serving more as secondary allocation instruments. Overall, the DEX TradFi structure has transitioned from a “precious metals-led” regime to an “energy-driven” one, highlighting a shift in trading logic from hedging to volatility-driven macro trading. This trend is consistent with broader on-chain capital flows migrating toward high-frequency trading pathways.
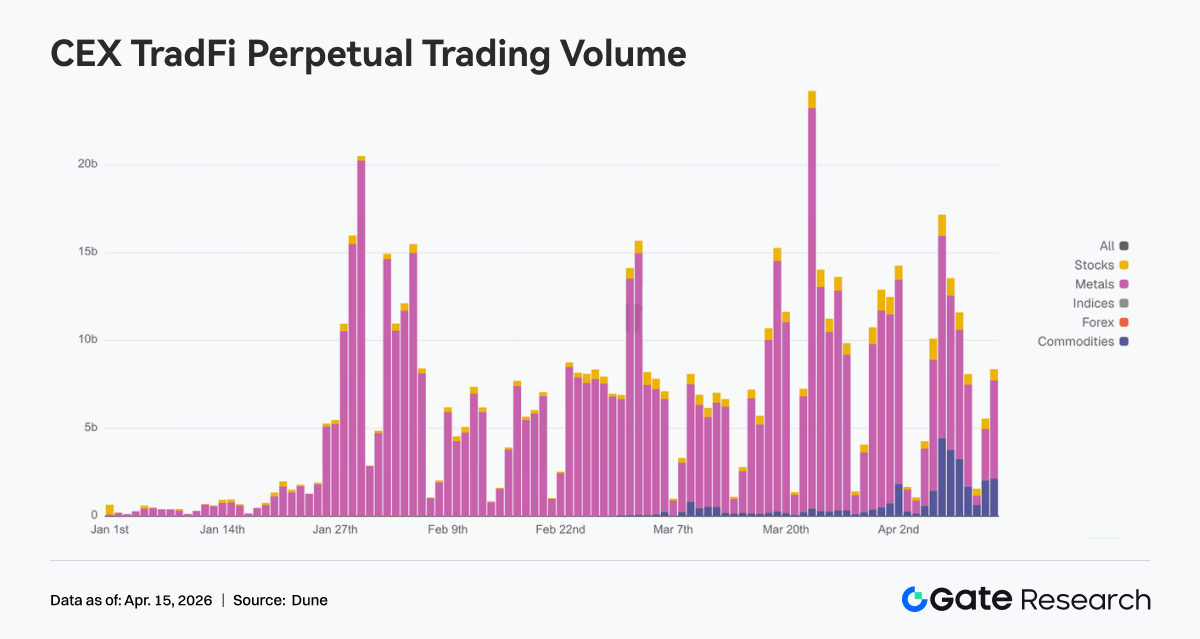
On the CEX side, TradFi perpetual futures volumes remained elevated, exhibiting a pattern of “concentration with amplified volatility.” Precious metals, particularly gold, continued to dominate trading volumes amid ongoing macro uncertainty and shifting inflation expectations. At the same time, energy commodities experienced episodic spikes in volume during the week, reflecting increased demand to trade oil and macro-driven events.
From a timing perspective, trading volumes surged midweek in response to macro data releases and geopolitical catalysts, before easing slightly but remaining above prior baselines. Structurally, TradFi trading is evolving from a single safe-haven-driven model into a multi-asset framework centered on “gold, oil, and equity indices.” This shift underscores a broader transition from allocation-driven strategies toward macro volatility-focused trading.
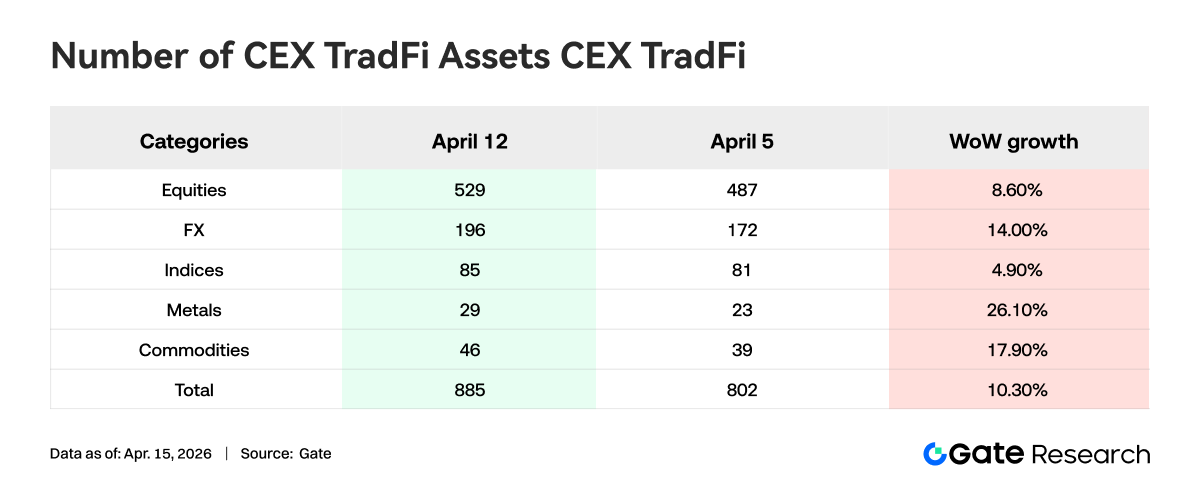
Over the past week, the number of TradFi asset categories on CEX platforms expanded further. Across the three major exchanges, the total count of TradFi assets (including only TradFi and CFD products, excluding perpetual futures) increased from 802 to 885, representing a 10.3% week-over-week rise.
Among these, metals saw the most significant growth, increasing from 23 to 29 instruments, up 26.1% week-over-week. Commodities ranked second in growth, rising from 39 to 46 instruments, reflecting a 17.9% increase.
We selected XAUT, the highest-volume TradFi asset, to analyze its order book depth (Delta). Over the past week, XAUT’s order book exhibited a “weak-to-strong” pattern, with liquidity gradually recovering.
Around April 8, XAUT prices rebounded तेजी, accompanied by a clear increase in positive Delta. Buy-side depth strengthened during this phase, indicating that capital began to actively lift offers and provide liquidity on the upside.
However, from April 9 to April 12, although prices remained elevated and moved sideways, the order book shifted back to predominantly negative Delta. This suggests persistent sell-side pressure at higher levels and reflects ongoing market disagreement in the upper range.
Notably, over the weekend, positive Delta rebounded again alongside further price strength, indicating that buy-side liquidity regained dominance and market sentiment improved.
Overall, XAUT’s depth structure suggests that amid rising gold prices, capital has transitioned from defensive unwinding to reallocation. While liquidity has shown marginal improvement in the short term, overhead supply remains present, and the sustainability of buy-side demand warrants close monitoring.
3. On-Chain Data Insights
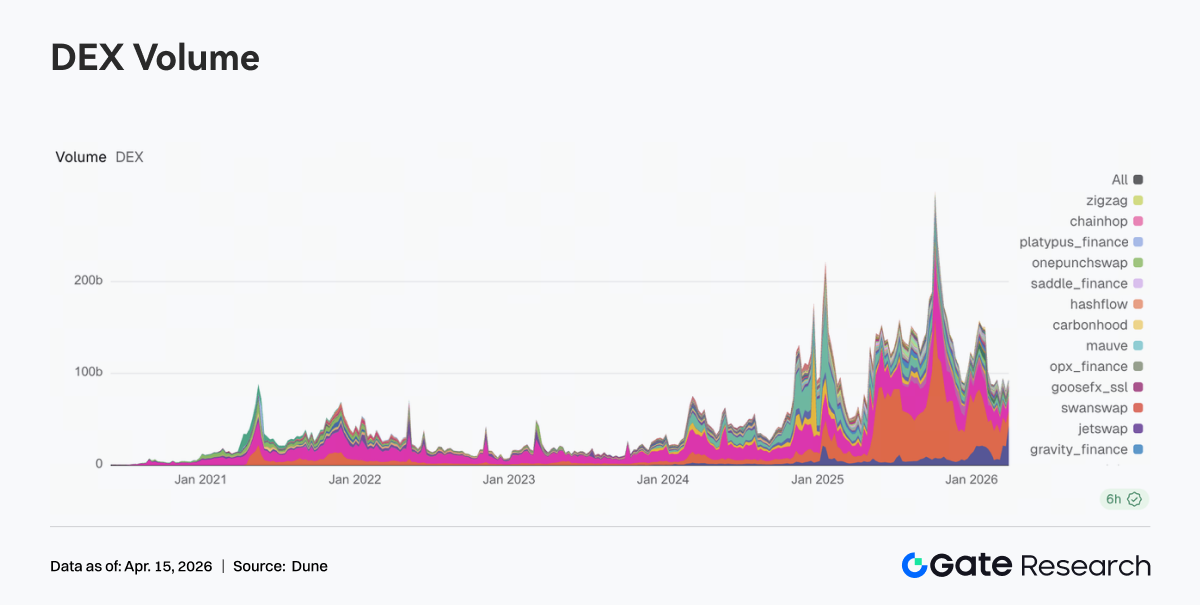
The top position in DEX trading volume has shifted back to Uniswap, which recorded $13.85 billion in weekly volume, followed by PancakeSwap at $10.33 billion. Compared to the previous week, PancakeSwap saw a decline, while Uniswap posted a notable increase, indicating that capital has rotated back toward leading platforms with deeper liquidity and more mature trading pairs.
In addition, emerging ecosystems such as Base, represented by Aerodrome and Bisonfi, absorbed part of the active capital flow. On the other hand, Solana-based platforms including Whirlpool, Raydium, and Humidifi all experienced declines, suggesting that trading activity within the Solana ecosystem has not expanded broadly.
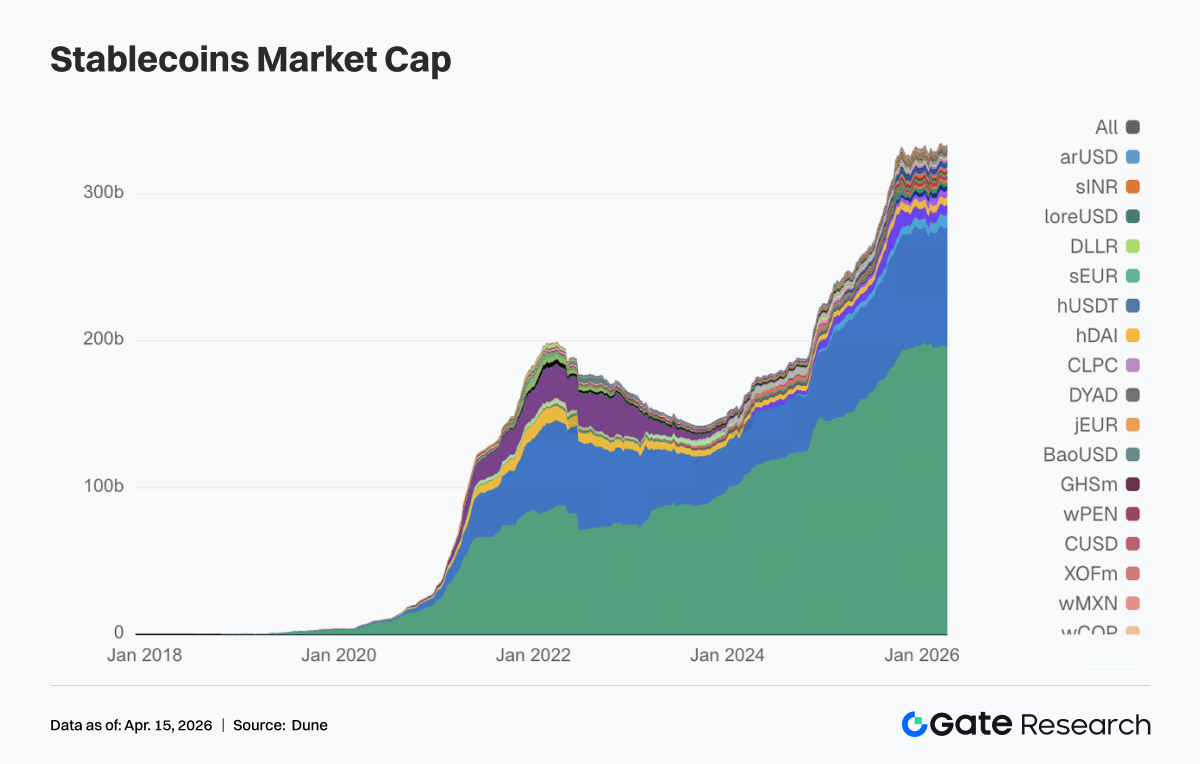
2. Stablecoin Supply Remains Elevated, with USDC as the Primary Source of Incremental Liquidity
The stablecoin sector showed no significant volatility this week, with overall supply remaining at elevated levels while undergoing structural rebalancing. USDT remained largely unchanged week over week, indicating that underlying USD liquidity continues to be stable.
In contrast, USDC increased from $798.68 billion to $810.49 billion, making it the most notable source of incremental liquidity this week. This suggests that capital is reallocating toward mainstream settlement-oriented dollar assets.
On the other hand, decentralized stablecoins such as USDS, USDe, DAI, and GHO all saw slight declines, indicating a lack of coordinated momentum within the decentralized stablecoin segment this week.
At the margin, USDG and PYUSD both recorded increases, suggesting that capital rotation is still ongoing within payment-oriented and newly issued stablecoins.
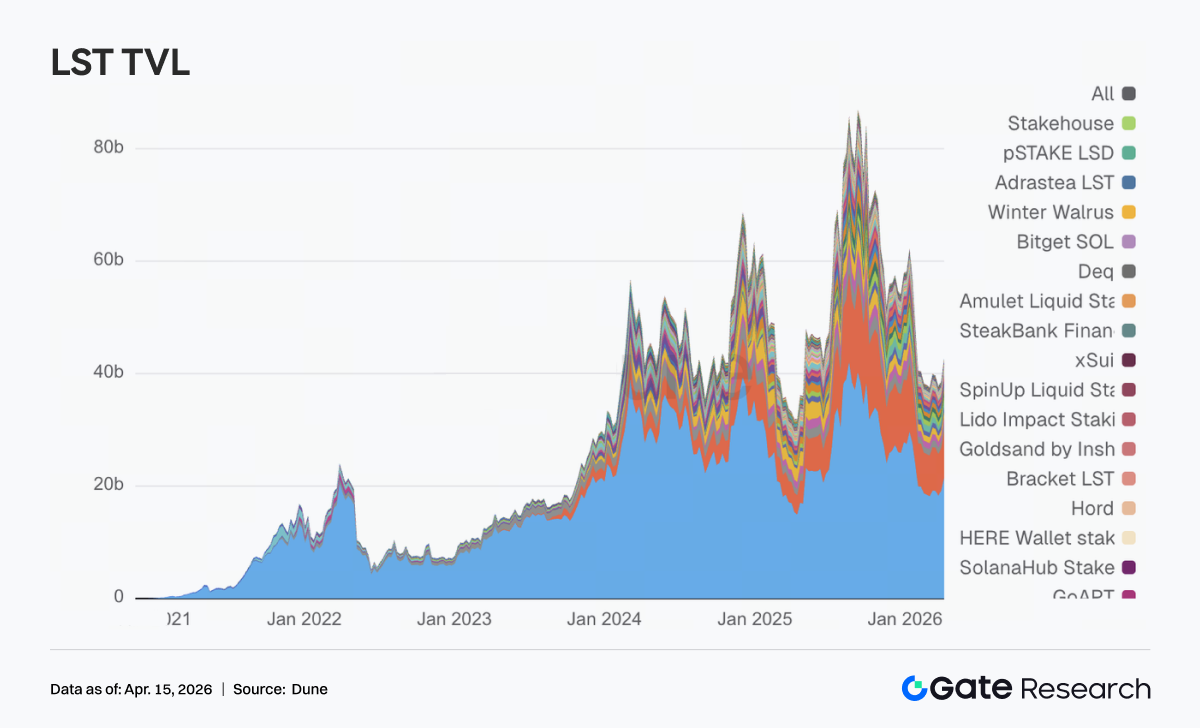
3. Liquid Staking Sees Broad-Based Recovery, with ETH and SOL Leading Position Rebuilding
This week, most leading liquid staking protocols recovered from prior drawdowns. On the ETH side, Lido rebounded to over $21 billion in TVL, while Rocket Pool climbed back above $1.3 billion, signaling renewed strength among top-tier protocols.
A similar recovery was observed in the Solana ecosystem. Sanctum Validator LSTs rose to $1.13 billion, while Jito and Jupiter Staked SOL also recorded notable increases.
Overall, this week’s move reflects a coordinated recovery following the rebound in risk appetite, with capital first rotating back into leading protocols. At the same time, Lido’s ongoing product developments over the past month, including EarnETH, EarnUSD, and first-loss protection mechanisms, are further refining yield and risk segmentation. These more institution-oriented tools are likely to enhance the willingness of large-scale capital to re-enter the market.
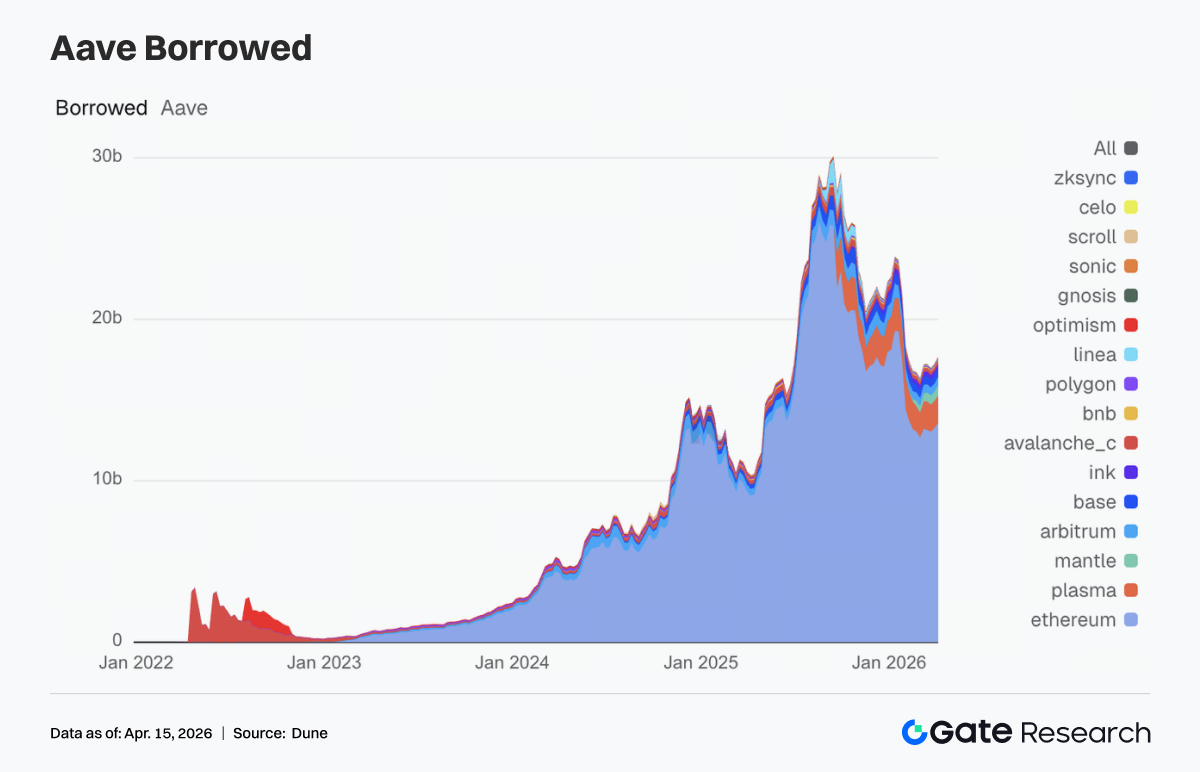
4. Aave Lending Turns Upward, with Core Market, Mantle, and Plasma Driving Growth
Aave lending volume increased to approximately $17.69 billion, up from $17.25 billion the previous week. Within this, the Ethereum main market rose from $13.27 billion to $13.57 billion, serving as the primary driver of overall growth.
At the same time, Plasma expanded from $1.66 billion to $1.71 billion, while Mantle increased from $590 million to $640 million. Base and Arbitrum also climbed to around $517 million each, indicating a synchronized recovery in multi-chain lending demand.
In contrast, secondary markets such as Avalanche, BNB Chain, and Polygon saw limited changes. Incremental borrowing demand remains concentrated in ecosystems with the deepest liquidity and highest capital efficiency.
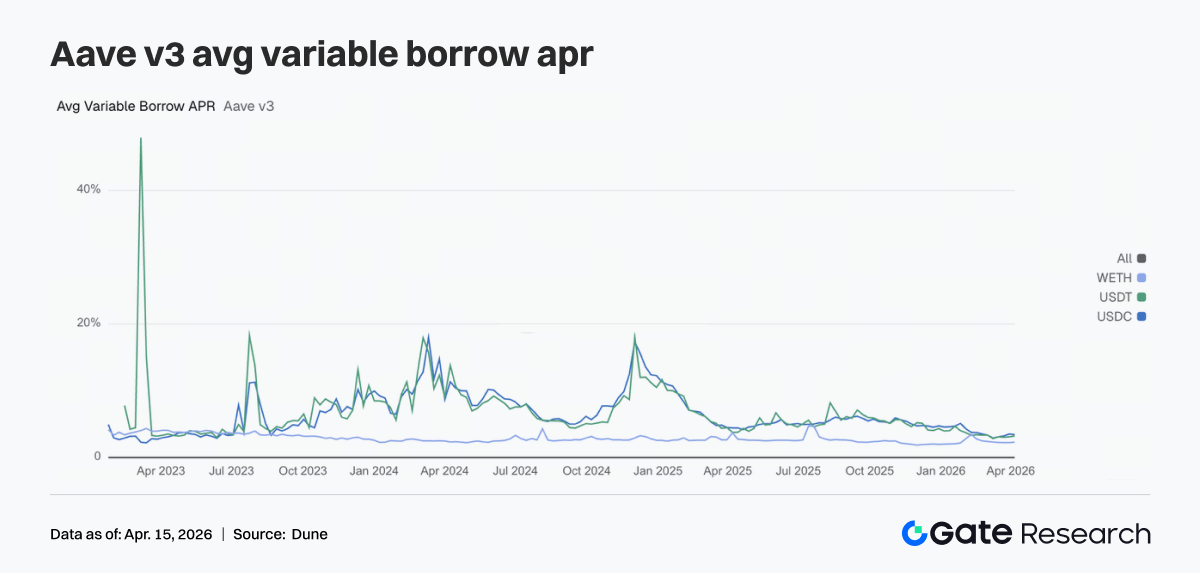
5. Diverging Borrowing Rates on Aave, USDC Eases While USDT and WETH Trend Higher
Borrowing rates across Aave’s three core assets did not move in the same direction. The average floating borrow APR for USDC declined from 3.51% to 3.42%, indicating a modest easing in funding pressure. In contrast, USDT rose from 3.10% to 3.22%, while WETH increased from 2.23% to 2.29%, suggesting that borrowing costs are beginning to tilt toward these two assets.
This combination typically reflects a clear trading dynamic: although total lending demand is expanding, incremental borrowing is no longer concentrated in USDC, but is instead partially rotating back into USDT for liquidity turnover and into ETH for position management.
Looking ahead, if Aave V4 successfully implements risk isolation and cross-market routing, interest rate dispersion across assets could widen further. Early signs of this trend are already emerging in the current week’s data.
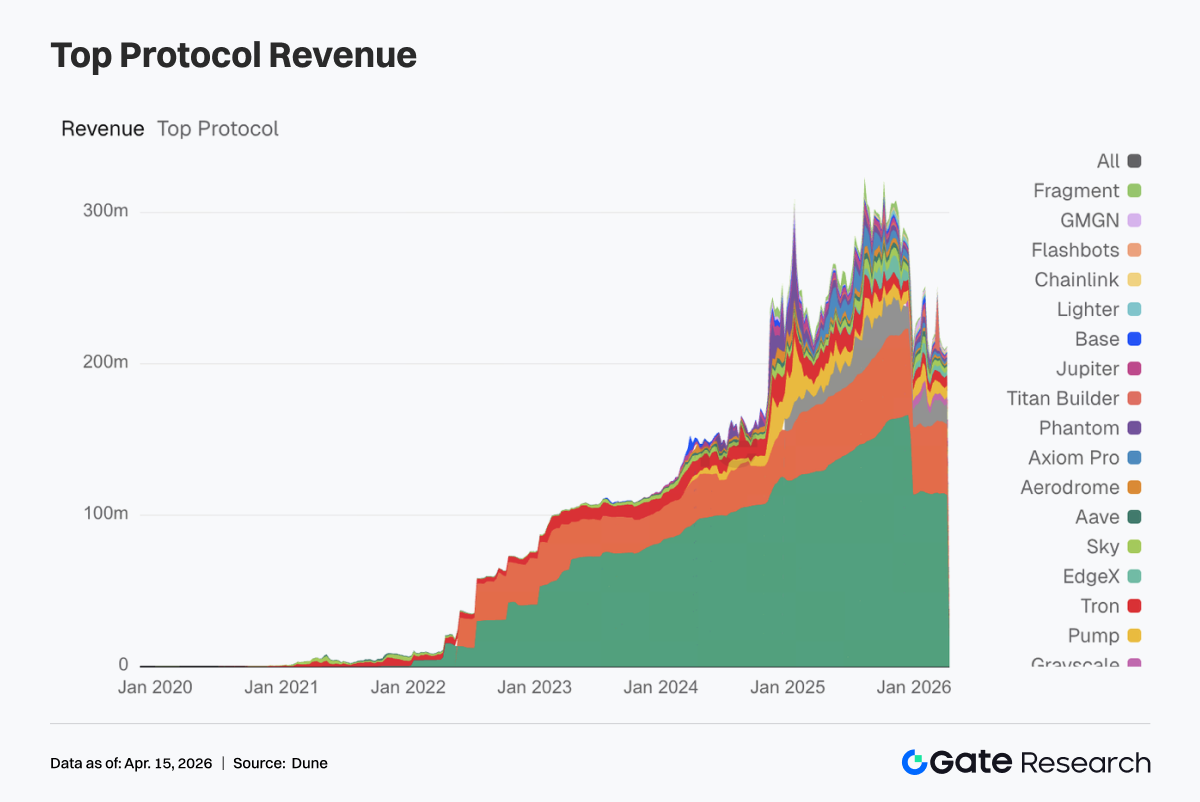
6. Protocol Revenue Rotates Back to Trading Infrastructure, with Hyperliquid Rebounding Strongly
No abnormal spikes were observed in protocol revenue this week. Tether and Circle remained firmly in the top two positions, underscoring that stablecoin issuance continues to serve as the most resilient revenue foundation in the crypto ecosystem.
Among trading-focused protocols, Hyperliquid saw a notable rebound, with revenue rising from $11.323 million to $13.677 million. Titan Builder surged from $558,000 to $1.438 million, while Aerodrome increased from $1.113 million to $1.960 million. This indicates that both capital and trading flow are rotating back toward more efficient infrastructure layers.
In contrast, front-end and distribution-layer platforms experienced a pullback. Phantom declined from $1.976 million to $1.332 million, while Jupiter dropped from $1.541 million to $928,000, suggesting cooling activity at the user entry and traffic aggregation layers.
Aave revenue rose to $1.441 million. Although the increase was modest, its position remained relatively stable, with lending protocols continuing to demonstrate higher earnings quality compared to high-turnover trading platforms.
Overall, revenue trends send a clear signal: the market has not moved away from trading activity, but capital is reallocating toward infrastructure segments with higher execution efficiency, stronger settlement capabilities, and more stable cash flow profiles.
4. Derivatives Tracking
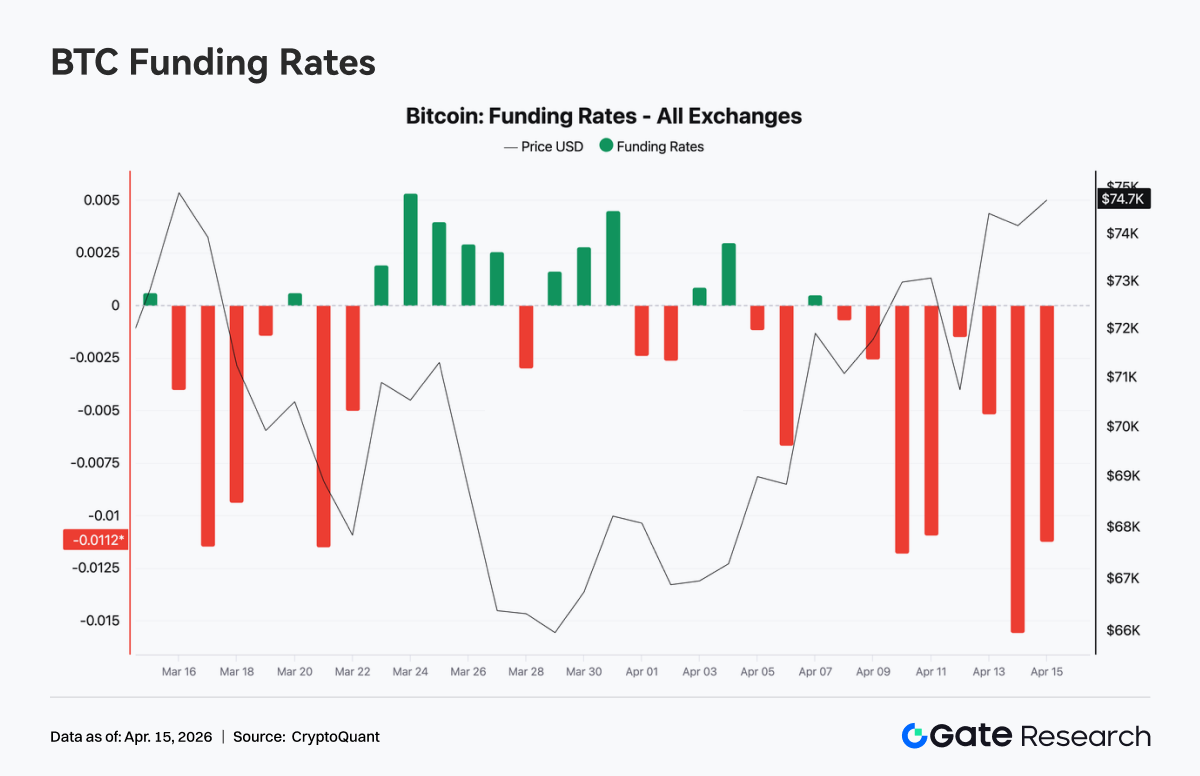
4.1 BTC Funding Rates Turn Deeply Negative While Price Strengthens, Open Interest Rebounds to Local Highs
Over the past week, BTC funding rates remained consistently in negative territory and reached an extreme low around April 13, briefly approaching -0.015. This indicates that bearish sentiment has been dominant in the perpetual futures market, with short positioning becoming increasingly crowded.
However, at the same time, spot prices rebounded from around $69K to above $74K, forming a classic divergence where prices rise while funding rates remain negative. This structure typically suggests that short positions are paying funding while facing upward price pressure, implying latent short squeeze potential. Overall, the market is currently characterized by bearish sentiment dominance, while price action is being driven by spot demand or structural buying. In the short term, this setup increases the likelihood of short covering and accelerated upside during volatility.
Total BTC open interest across the market rose rapidly over the past week, climbing from approximately $22.5 billion to around $25.3 billion, in tandem with the price rebound above $74K. This indicates a clear return of leveraged capital into the market. Notably, around April 11, open interest briefly dropped sharply, likely due to liquidations or forced deleveraging, before quickly recovering and reaching new highs. This pattern of initial deleveraging followed by re-leveraging often signals that weaker positions have been flushed out and replaced by new trend-driven capital.
Combined with persistently negative funding rates, the rebound in open interest suggests that positioning may still be driven by short and hedging flows. The market is currently in a high-leverage, directionally divided but net-bearish state. If prices continue to move higher, the potential for an extended short squeeze remains significant.
4.2 Event-Driven Crowding in the Short End, Defensive Positioning in the Mid-to-Long Tenor
Options activity exhibited a clear event-driven pattern. Both monthly and daily options saw increased volume, with daily options peaking on April 10 as short-term traders engaged in high-frequency positioning around post-ceasefire volatility reversals. Monthly options, on the other hand, saw concentrated volume during April 7–8 amid ceasefire expectations, reflecting institutional repositioning over a medium-term horizon during the geopolitical window.
In contrast, weekly options continued to see declining volume, indicating a lack of clear directional consensus in the 1–2 week timeframe. From a maturity perspective, trading activity was concentrated in same-day expiry and next Friday expiry contracts, highlighting strong short-term hedging demand. Activity in mid- and long-dated tenors declined, with positioning remaining broadly neutral.
In block trades, BTC strategies were primarily focused on term structure arbitrage, such as long short-end volatility and short mid-tenor volatility. ETH activity was dominated by premium-selling strategies, including short straddles. This suggests that the market is currently trading volatility structure and range dynamics, rather than expressing strong directional views.
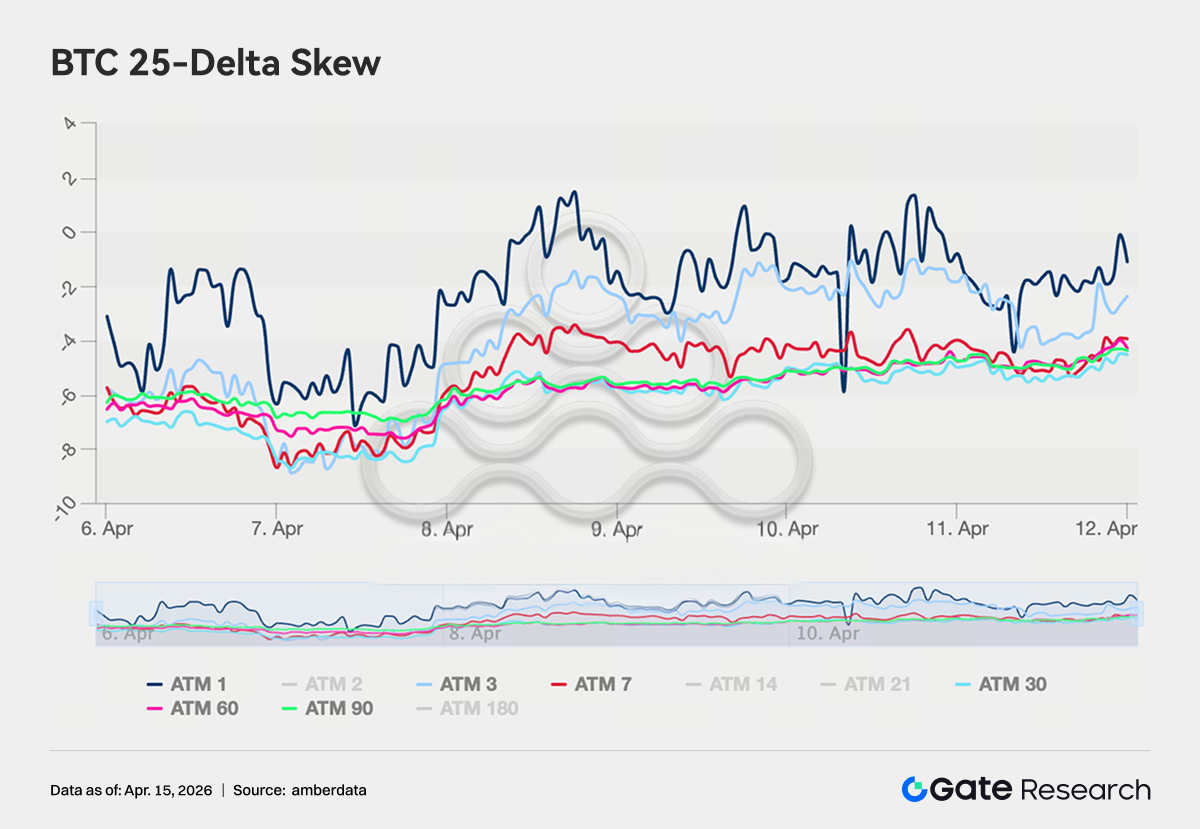
4.3 Defensive Premium Persists, but Bearish Sentiment Is Moderating at the Margin
BTC 25-delta skew remained in the -4 to -8 vol range across tenors, indicating that put premiums continue to dominate and that the market still maintains demand for downside protection. However, compared to the more extreme -8 to -11 vol range observed in late March, skew has shifted higher by approximately 2–3 volatility points, signaling a marginal easing of bearish sentiment.
ETH skew has shown a more pronounced shift, moving from the previous -5 to -8 vol range up to approximately -3 to +2 vol, with some tenors approaching symmetry. This suggests that the market’s pricing of tail downside risk has significantly compressed.
That said, long-dated skew has not yet turned decisively positive, indicating that institutional positioning has not fully shifted into an outright risk-on stance. Instead, the current setup reflects a reduction in defensive positioning, but not a complete unwind of downside hedges.
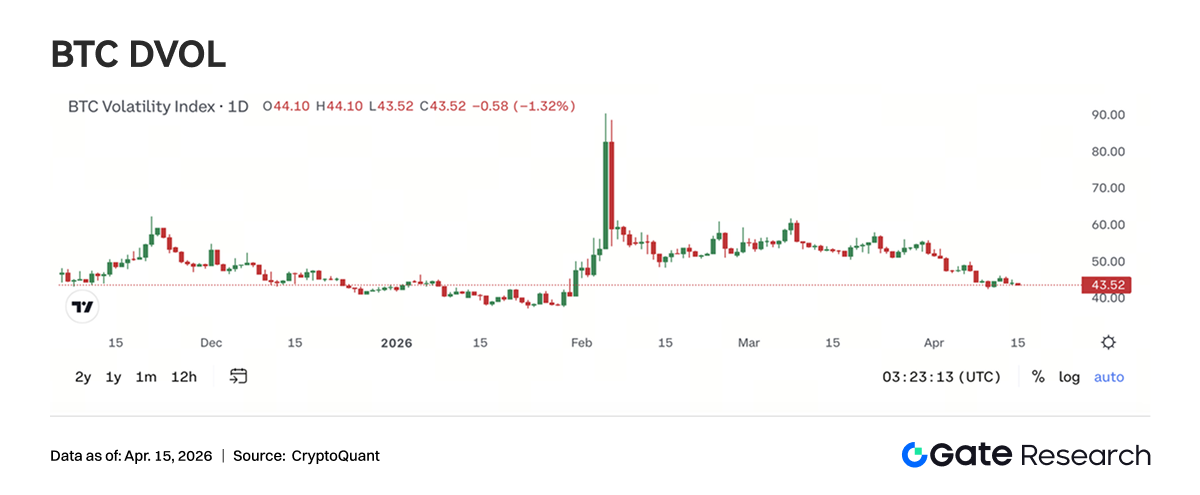
4.4 DVOL Returns to Baseline Range, Volatility Premium Enters Compression Phase
BTC DVOL is currently around 44.76, having declined significantly from the extreme levels above 90 triggered by geopolitical tensions in early February. It has now largely returned to the baseline range seen in mid-January. The April ceasefire event only caused a brief spike (from 45 to 50), followed by a rapid pullback, indicating that the market is no longer assigning elevated volatility premiums to isolated geopolitical events.
At present, BTC DVOL is hovering near its six-month average support range of 45–48. A further decline toward 40 would place it into historically low volatility territory. ETH DVOL is currently around 65.50, also reverting to pre-conflict levels, though it still trades roughly 20 volatility points above BTC.
Combined with the prevalence of premium-selling strategies such as short straddles and short volatility positions observed in block trades, it is clear that the dominant market view is one of a low-volatility, range-bound environment. Overall, implied volatility appears to be nearing the end of its compression phase. While the return potential for volatility sellers is narrowing, this environment is simultaneously creating a more attractive entry point for medium-term long volatility strategies.
5. Outlook
6. Gate Institutional Updates
Trading Performance: Structural Optimization, Outperforming the Market
-
Spot and derivatives trading both outperformed the broader market, with derivatives performance leading the industry.
-
Following the iteration of market-making fee structures and evaluation rules, mid-tier client activity increased significantly, and the overall trading structure continues to improve.
CrossEx: Record High Trading Volume and Assets, Accelerating Integration with Asset Management Platforms
-
Ongoing incentive programs continue to drive deposit inflows and trading activity. Multiple clients have transitioned into live trading and strategy deployment, with both trading volume and assets under management reaching all-time highs.
-
Integration with asset management platforms and OTC Loan services continues to advance.
Funding Business: Demand Recovery with Structural Divergence
-
Both flexible products and cross-margin lending saw notable growth.
-
Borrowing demand for ETH, USDT, and other high-interest assets rebounded significantly.
Technology Progress: Dual Improvements in Performance and Functionality
-
WebSocket SBE has been launched, improving data transmission efficiency.
-
AI-powered customer service bots have been initially deployed, gradually enhancing BD operations and client support capabilities.
Sources:
-
Investing, https://investing.com/currencies/xau-usd-historical-data
-
Gate, https://www.gate.com/trade/BTC_USDT
-
CMC, https://coinmarketcap.com/real-world-assets/?type=all-tokens
-
Coinglass, https://www.coinglass.com/pro/depth-delta
-
Dune, https://dune.com/gateresearch/gate-tradfi#weekly-volume
-
Dune, https://dune.com/gateresearch/gate-institutional-weekly-report
-
Bybit, https://www.bybit.com/future-activity/en/tradfi
-
Bitget, https://www.bitgettradfi.com/tradfi/XAUUSD
-
CryptoQuant, https://cryptoquant.com/asset/btc/chart/derivatives
-
Amberdata, https://pro.amberdata.io/options/deribit/btc/current/
Gate Research is a comprehensive blockchain and cryptocurrency research platform that provides deep content for readers, including technical analysis, market insights, industry research, trend forecasting, and macroeconomic policy analysis.
Disclaimer
Investing in cryptocurrency markets involves high risk. Users are advised to conduct their own research and fully understand the nature of the assets and products before making any investment decisions. Gate is not responsible for any losses or damages arising from such decisions.