This means: with 50x leverage, just a 2% price move can lead to your position being liquidated.
Therefore, in high-leverage markets, even small price fluctuations can evolve into structural risks.
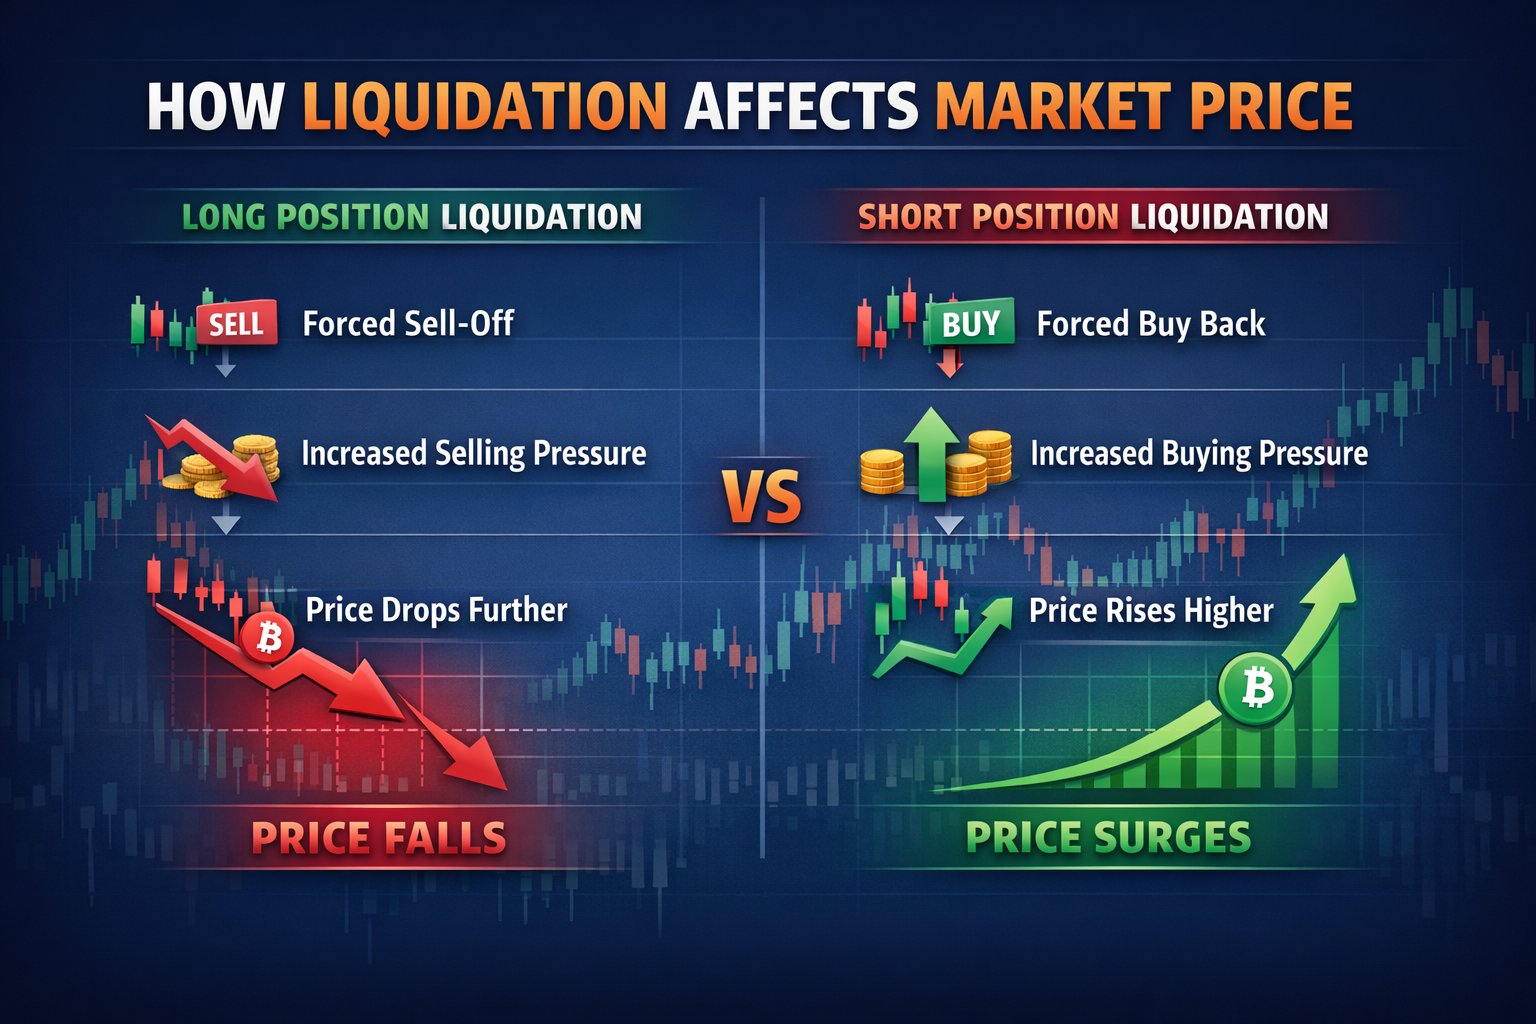
III. How Liquidation Affects Market Prices
Many people see liquidation as a “passive result,” but in reality, liquidation itself is an active trading behavior in the market.
When liquidation occurs, the system automatically executes trades:
- Longs liquidated → forced sell-off of assets
- Shorts liquidated → forced buy-in of assets
This directly alters market supply and demand.
Specifically:
- Long liquidation → increased selling pressure → further price decline
- Short liquidation → increased buying pressure → further price increase
Therefore, liquidation is not just the result of price changes; it can also actively drive further price movement.
From a market structure perspective, liquidation can be seen as passively triggered but actively executed trading force.
IV. The Liquidation Chain: From Single Trigger to Chain Reaction
In low-leverage environments, liquidations are usually scattered events.
But in high-leverage markets, liquidations rarely occur in isolation; instead, they often appear as chain reactions.
A typical liquidation chain is as follows:
Price drops → some long positions are liquidated → forced asset sales → further price drop → more positions enter liquidation range → liquidation scale expands.
This continuous process is known as a “liquidation cascade.” In extreme cases, this chain reaction can rapidly amplify market volatility, resulting in:
- Rapid declines (flash crashes)
- Or rapid surges (short squeezes)
The core characteristic is that price changes are structurally driven, not information-driven.
V. Long Squeeze and Short Squeeze
Liquidation chains typically manifest as two common market structure phenomena.
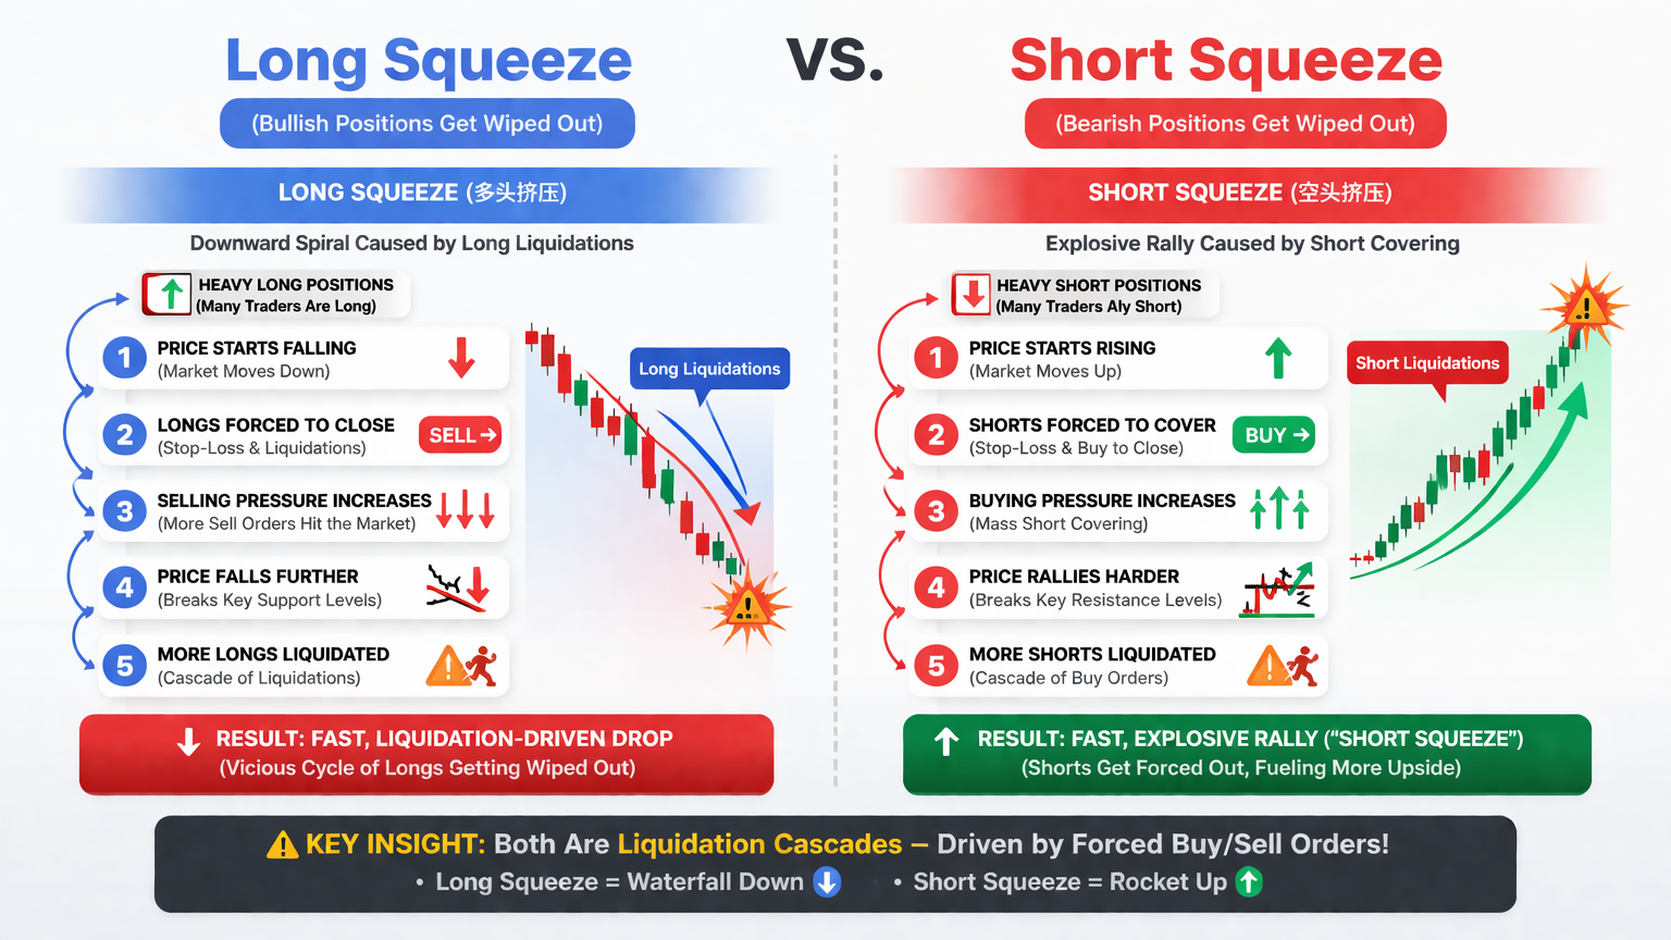
1. Long Squeeze
When market prices start to fall and long positions are concentrated:
- Longs are forced to close (sell)
- Selling pressure increases
- Prices continue to fall
- More longs get liquidated
Ultimately forming a continuous downtrend driven by liquidations.
2. Short Squeeze
When market prices rise and short positions are concentrated:
- Shorts are forced to cover (buy)
- Buying pressure increases
- Prices continue to rise
- More shorts get liquidated
Ultimately leading to rapid surges or even a “short squeeze.” In crypto markets, both phenomena are very common and are among the main reasons for sharp short-term volatility.
VI. Why Do Many Market Moves Seem “Unexplained”?
In traditional financial markets, price swings can usually be attributed to macroeconomic changes, policy shifts, company fundamentals, or industry news.
But in leverage-driven crypto markets, many sharp moves appear to have “no reason.”
The core reason is: price itself can trigger the next round of price movement.
In other words, there is a self-reinforcing mechanism:
- Uptrend → triggers short liquidation → drives further uptrend
- Downtrend → triggers long liquidation → drives further downtrend
In this structure: price is not just an outcome but also part of the process.
This explains why many market moves appear:
- Sudden
- Accelerated
- Nonlinear
VII. The Importance of Position Structure
In markets dominated by the liquidation mechanism, prices are determined not only by buy-sell activity but also by the distribution of position structure.
Key indicators include:
- Open Interest
- Long/Short Ratio
- Funding Rate
These indicators reflect the current leverage distribution and directional crowding in the market.
When positions are overly concentrated in one direction, the market is prone to corresponding liquidation events.
For example:
- Crowded longs → more likely to see a long squeeze
- Crowded shorts → more likely to see a short squeeze
Therefore, understanding position structure in leveraged markets is often more important than simply predicting price.
VIII. Liquidation and Liquidity
Liquidation is not only a risk event but also an important source of liquidity in the market.
When large-scale liquidations occur:
- The system executes large volumes of buy or sell orders at once
- Massive liquidity is released in a short period
- Arbitrageurs and trend traders are attracted to participate
From a market structure perspective, liquidation is a form of passively generated liquidity.
This liquidity typically has the following characteristics:
- Appears suddenly
- Unidirectional flow
- Short duration
This is why significant market moves are often accompanied by spikes in liquidation data.
IX. How the Liquidation Mechanism Reshapes the Market
I. What Is Liquidation?
In leveraged trading, traders do not need to invest all their funds; they only need to provide a portion as margin to control a much larger position. This mechanism essentially acts as a capital amplifier but also introduces risk: when market prices move unfavorably, losses are magnified.
To prevent losses from exceeding account funds, trading platforms must implement a set of risk control mechanisms. When account equity drops below a certain threshold, the system will automatically force-close the position—a process known as liquidation.
In essence, liquidation is not a “punishment” but a necessary risk control mechanism. Its core objectives are:
- Preventing negative account balances
- Avoiding platform bad debt risk
- Protecting counterparties’ funds
Therefore, liquidation is one of the prerequisites for the leveraged trading system to function.
II. How Is Liquidation Triggered?
Liquidation is typically triggered by margin levels and leverage ratios.
In leveraged trading, platforms usually set a “maintenance margin.” When account equity falls below this level, the system triggers forced liquidation. The higher the leverage, the less room there is for price movement. In other words, with less capital controlling larger positions, you are more easily “squeezed out” by the market.
For example:
| Leverage Multiplier |
Approximate Liquidation Range |
| 5x |
Approx. 15%–20% |
| 10x |
Approx. 8%–10% |
| 20x |
Approx. 4%–5% |
| 50x |
Approx. 2% |
As leveraged trading scales up, the influence of the liquidation mechanism on markets continues to grow. A key structural feature of today’s crypto market is that price volatility increasingly relies on liquidation chains rather than just capital inflows or news events.
This brings several important changes:
- Markets are more prone to sharp short-term swings
- Trends can be rapidly amplified
- Market rhythm becomes more unstable
- Prices show stronger nonlinear characteristics
The market is shifting from “information-driven” to “structure-driven.” In this environment, ignoring the liquidation mechanism can easily lead to misjudging market trends.
Therefore, understanding liquidation is not just about risk management—it is fundamental to understanding how the market operates.
Lesson Summary
This lesson systematically analyzed the role of the liquidation mechanism in the crypto market. At its core, liquidation is a risk control tool within leveraged trading systems, but in practice it has evolved into an essential endogenous force driving price volatility.
Liquidation not only affects individual traders’ positions but can also create large-scale moves through chain reactions, significantly amplifying overall market volatility.