Just a few days after the market crash on October 10, Coinphoton reported that TRON (TRX) still maintained relative strength compared to the overall market. This resilience was once hoped to drive the price recovery process; however, in the past week, the bears have clearly demonstrated their dominance.
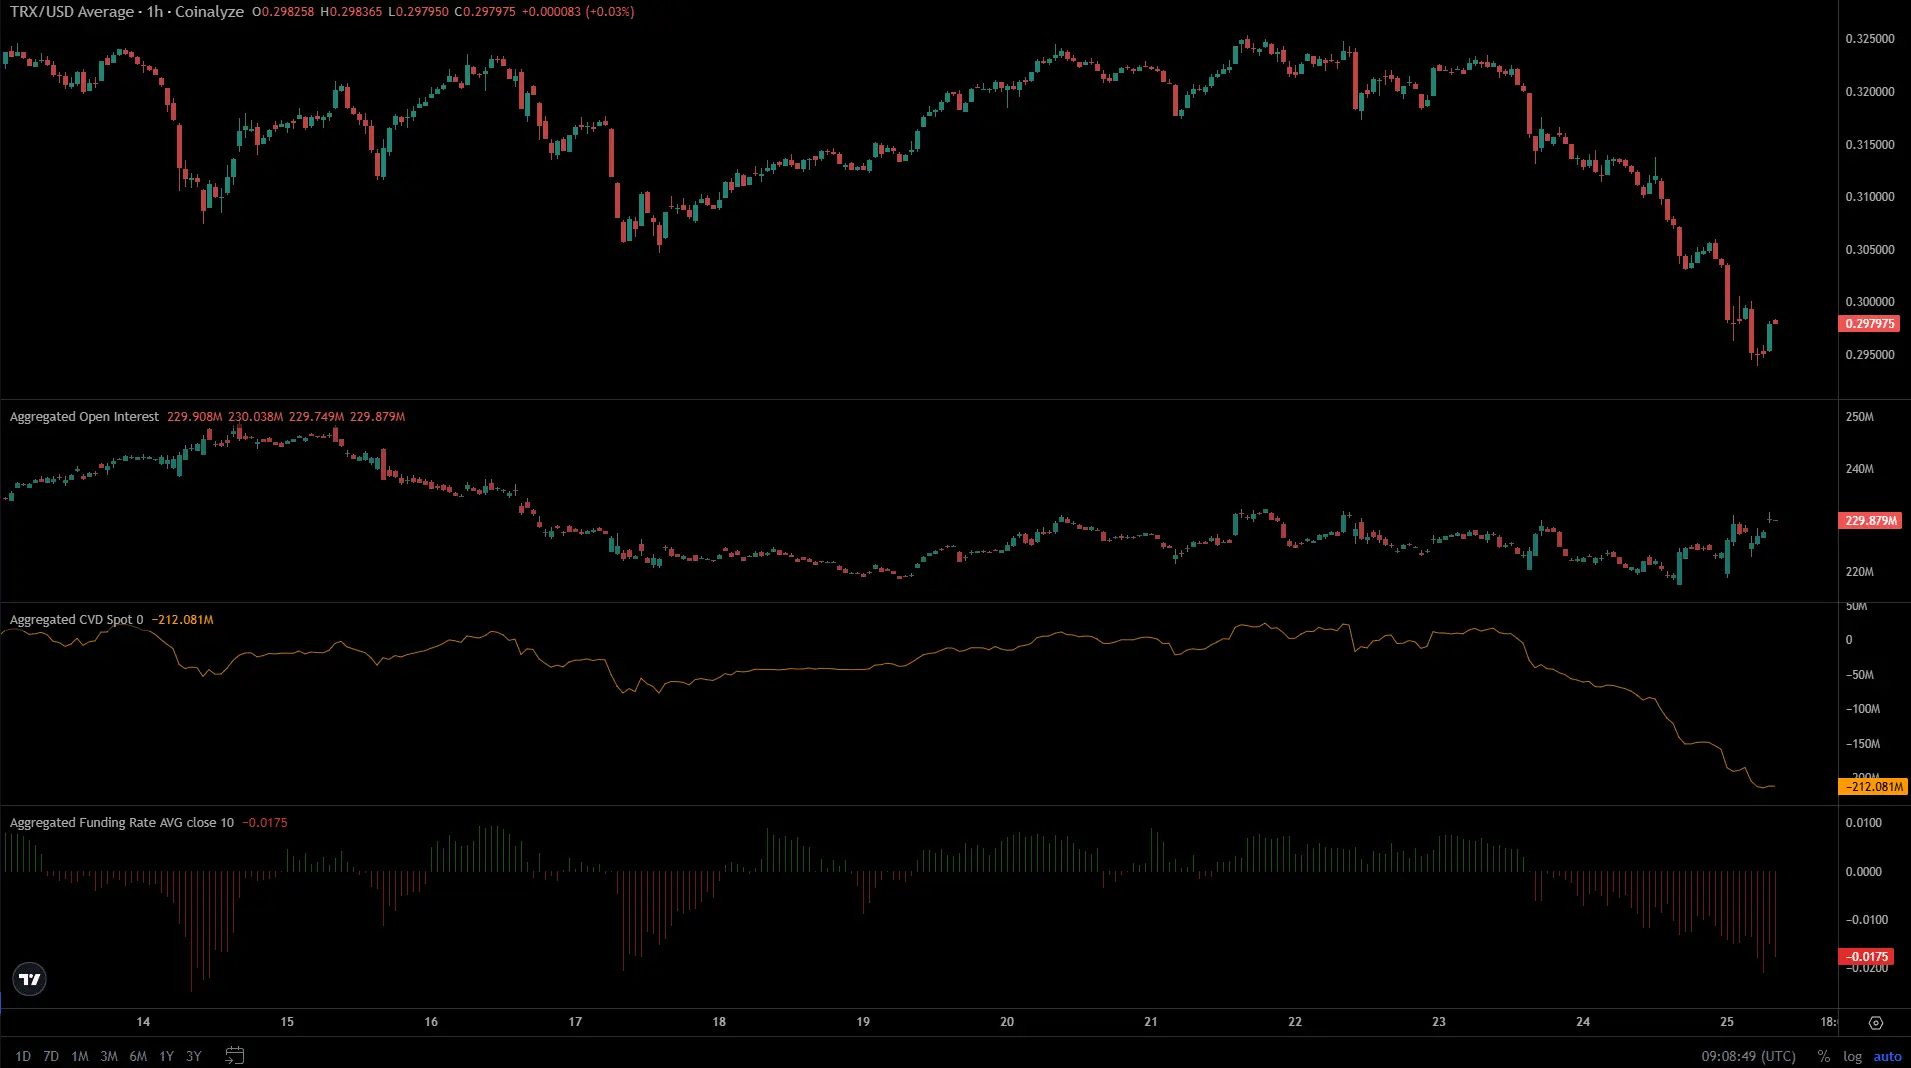 Source: CoinalyzeThe situation began with TRX being rejected at the local resistance area of $0.325 on Tuesday, October 21. In the last 48 hours, the CVD index has turned negative, reflecting strong selling pressure in the spot market. At the same time, the funding rate has also reversed to negative, while open contracts (Open Interest) continue to fluctuate around the mark of $230 million. In summary, these signals indicate that market sentiment is leaning towards bearish.
Notably, OI increased by $10 million in the past 24 hours despite prices continuing to decline, indicating that speculators are boldly betting on short positions for TRX.
TRON faces the risk of losing the support level of $0.3
The CVD taker index for spot trading has consistently maintained a downward trend since the end of August, reflecting a period where active sell orders dominate. Taker orders – which are market orders – often play a leading role in price trends. This aggressive selling pressure has been clearly reflected in the price chart of TRON.
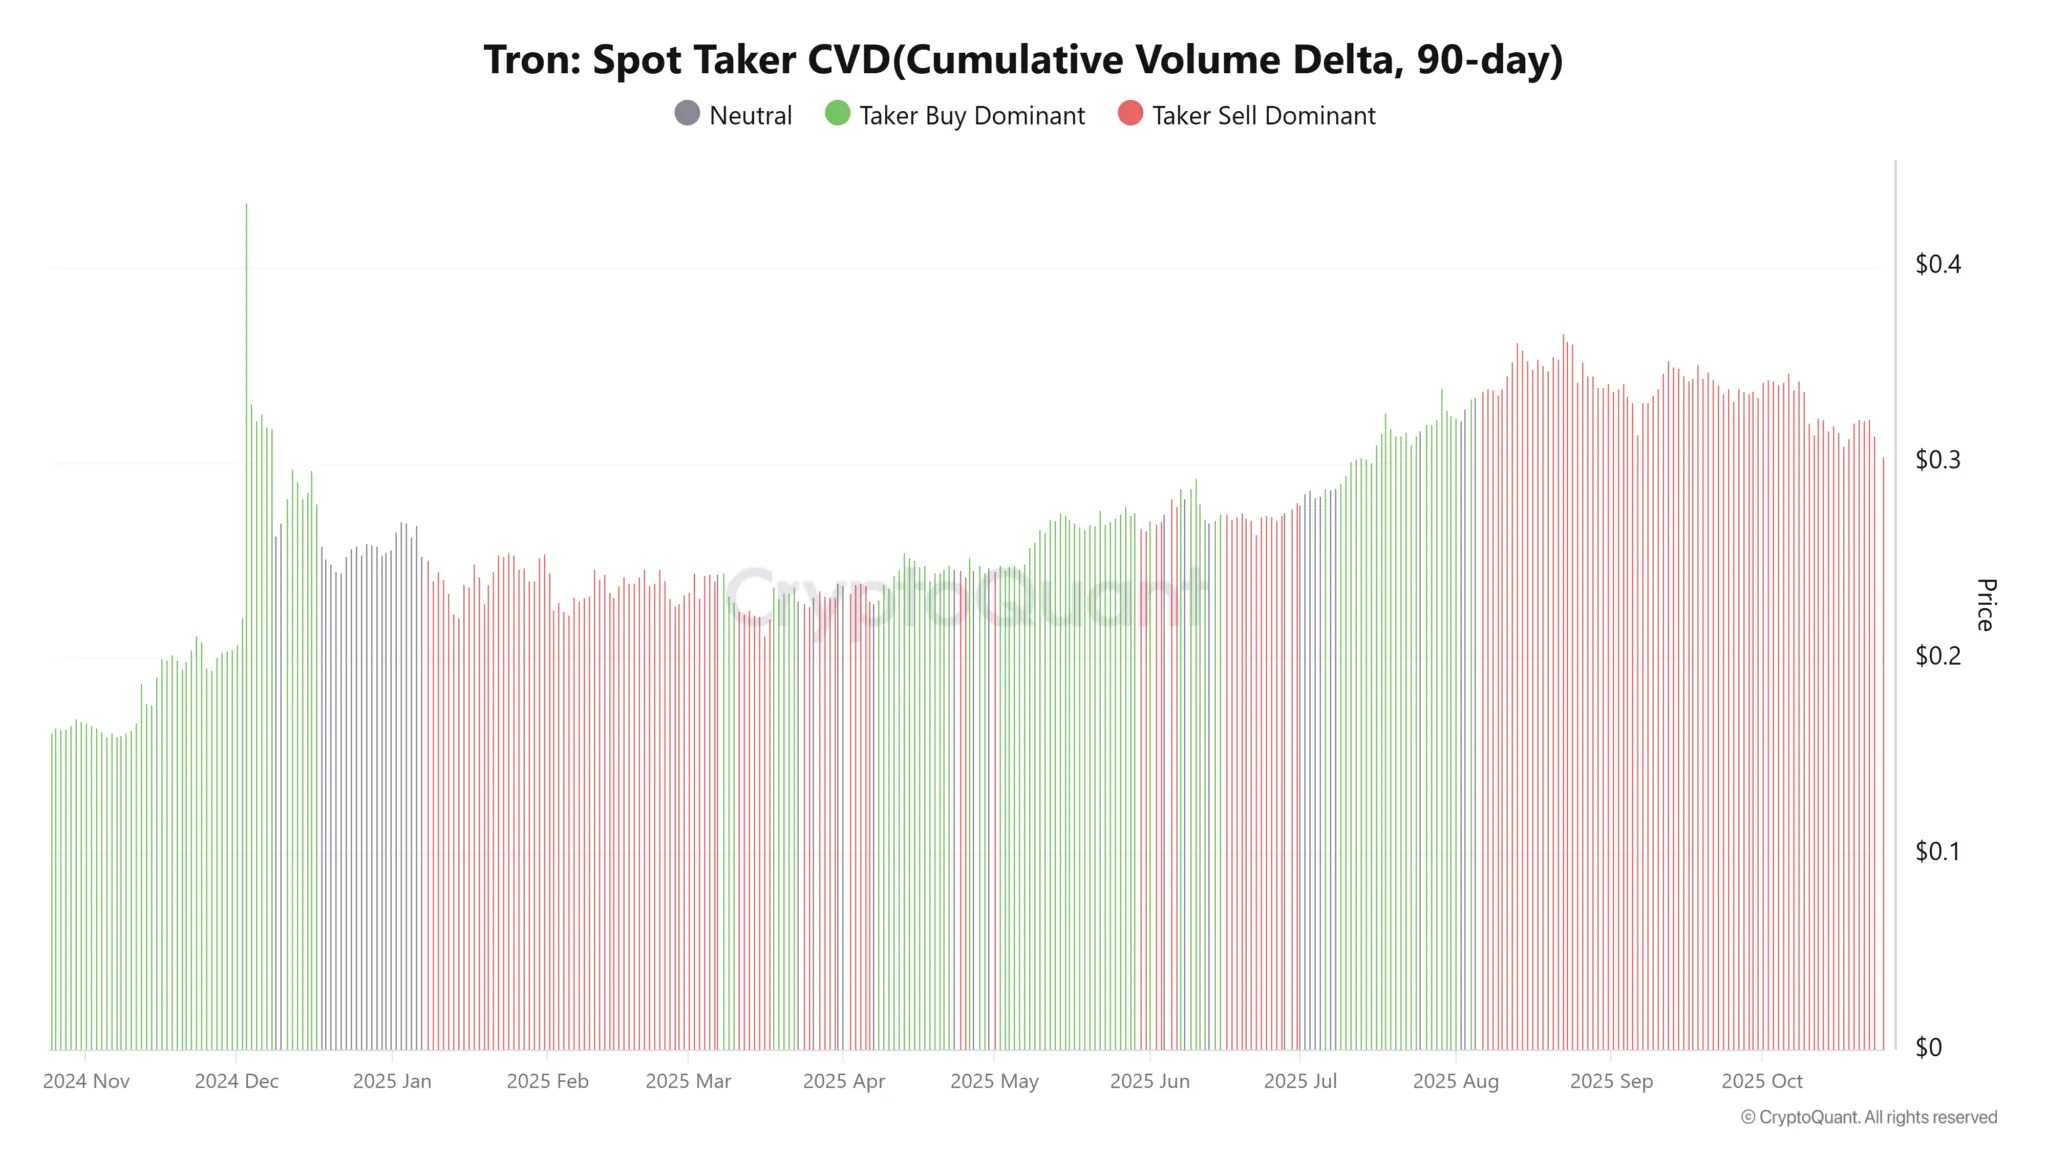 Source: CryptoQuantSince August, TRX has continuously set lower highs on the daily timeframe. Although this is not yet a confirmed bear market signal, it is a clear warning sign. TRX's repeated successful defense of the support area at $0.3 was once seen as a positive highlight, but this is now at risk of changing.
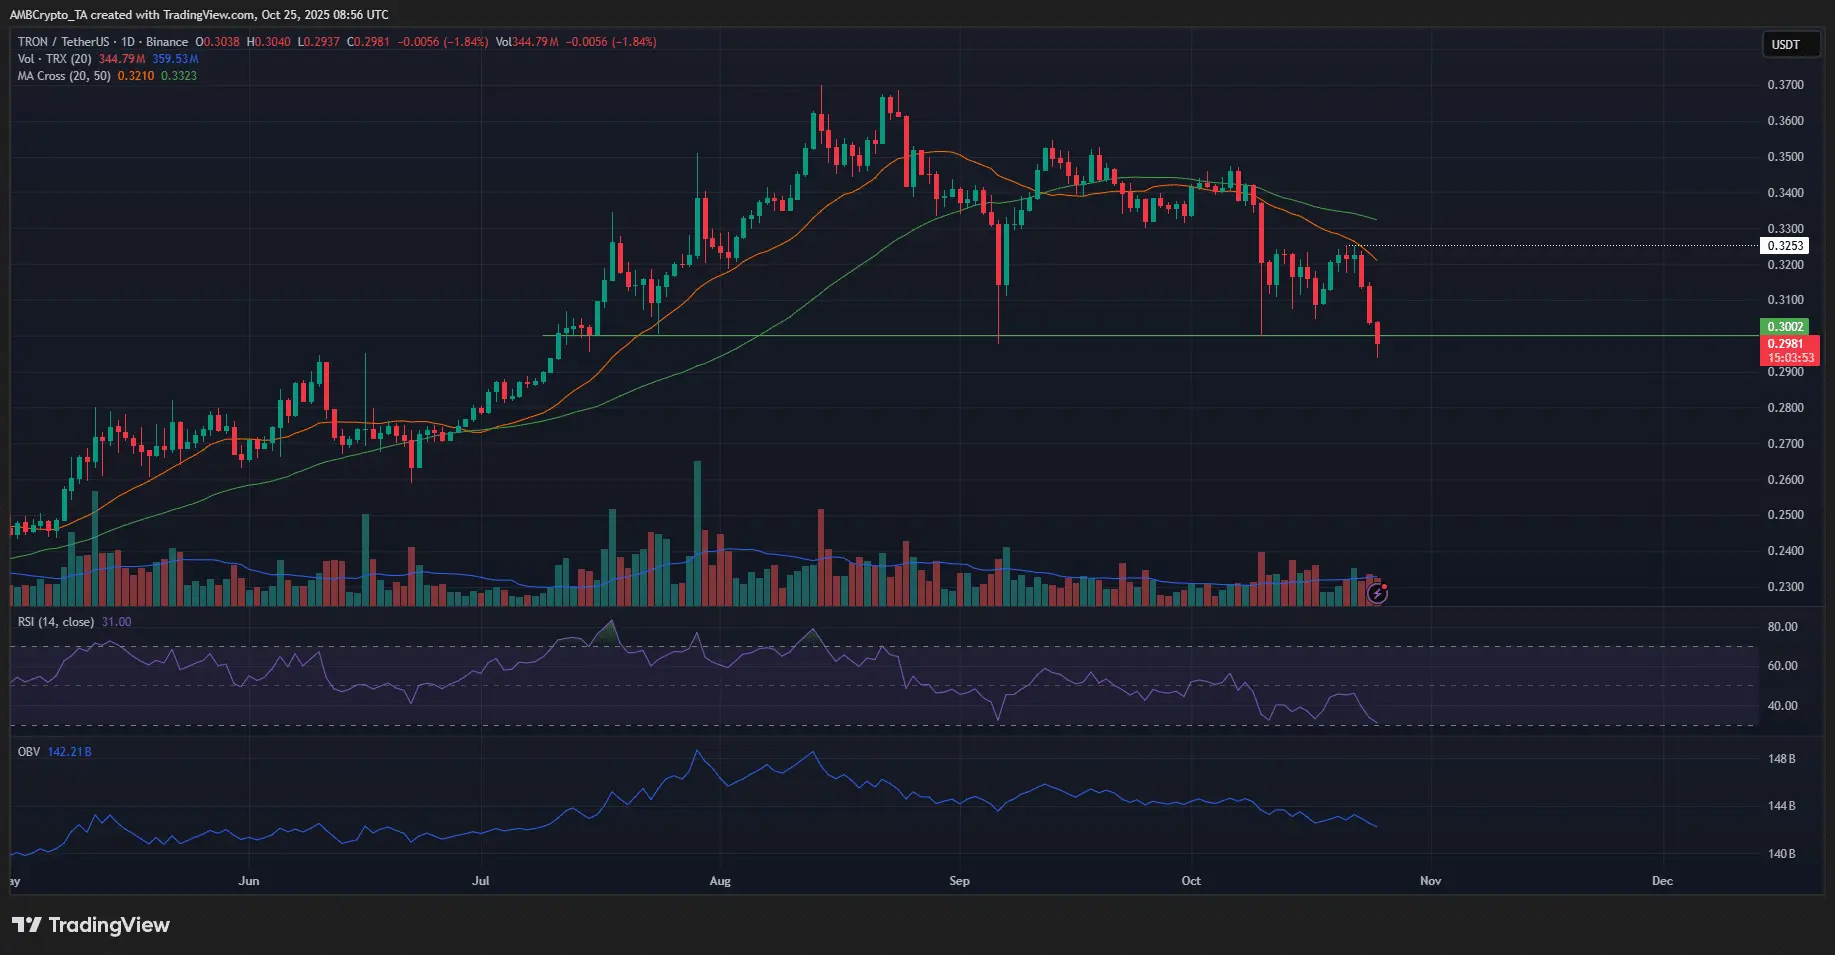 Source: TradingViewRecent trading activities have pushed the price of TRX below the $0.3 threshold, and if the daily trading continues to close below this level, the trend structure will officially shift to bearish. The RSI index remains below the neutral level of 50, along with moving averages all signaling negative momentum for the price.
The $0.325 area – where recent selling pressure began – is a crucial resistance level that needs to be converted into support if the bullish outlook is to be maintained. However, both the price and the OBV indicator are currently trending downward.
In this context, investors should consider waiting for a retest of the price range $0.30–$0.31 on the downside before opening a short position. If the downtrend is confirmed, the next target for TRX could be around $0.264.
Mr. Teacher
Disclaimer: The information on this page may come from third parties and does not represent the views or opinions of Gate. The content displayed on this page is for reference only and does not constitute any financial, investment, or legal advice. Gate does not guarantee the accuracy or completeness of the information and shall not be liable for any losses arising from the use of this information. Virtual asset investments carry high risks and are subject to significant price volatility. You may lose all of your invested principal. Please fully understand the relevant risks and make prudent decisions based on your own financial situation and risk tolerance. For details, please refer to
Disclaimer.