Pump.fun (PUMP), Story (IP), and Pudgy Penguins (PENGU) are experiencing a strong sell-off wave over the past 24 hours, indicating that market sentiment remains cautious. Both PUMP and IP are powerless against the important resistance level of the 50-day exponential moving average (EMA), triggering a correction phase on Wednesday’s trading session. Meanwhile, PENGU is retreating to test the 50-day EMA, reflecting ongoing profit-taking pressure. Overall, the technical outlook for these three cryptocurrencies remains negative, as the downward trend continues to dominate amid existing weakness.
Pump.fun faces the risk of sharp decline as bullish momentum wanes
As of Thursday when this article was written, Pump.fun is fluctuating around the 20-day EMA at $0.002248, after plunging 11% from the 50-day EMA at $0.002624 in the previous session. This move officially ends the eight consecutive bullish sessions for the token.
If PUMP loses the support zone at $0.002248, selling pressure could increase, pushing the price down to the psychological level of $0.002000. Further, the correction risk may extend to the S1 Pivot point at $0.001262.
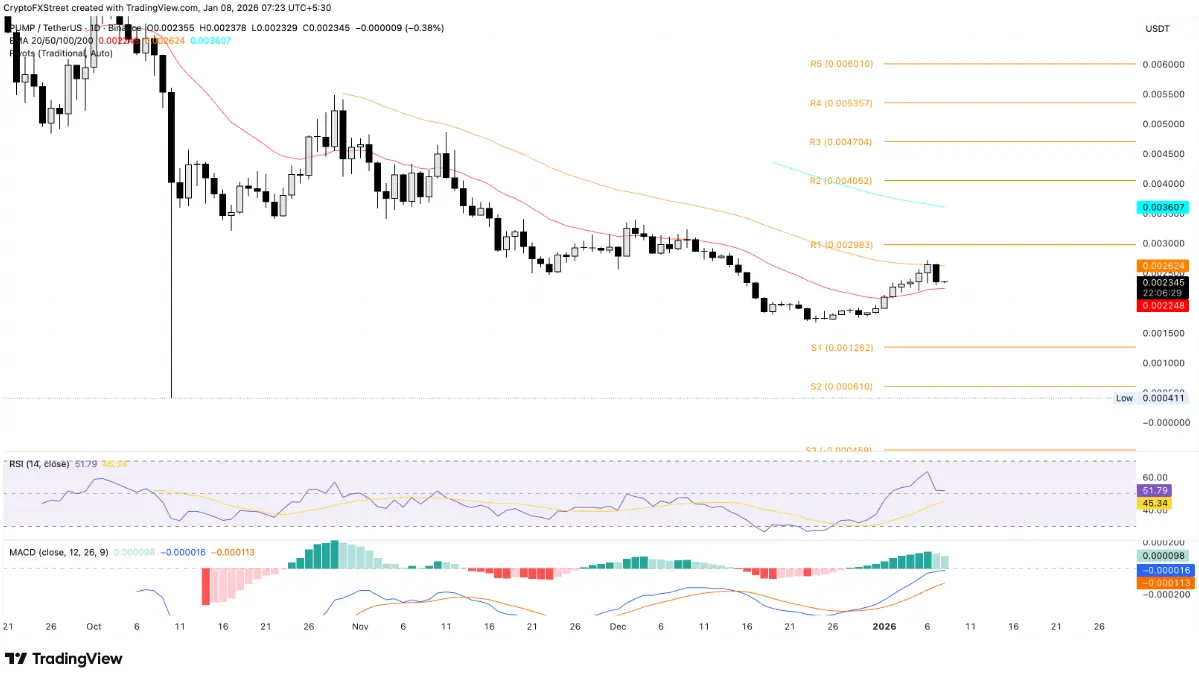 Daily PUMP/USDT chart | Source: TradingView The technical signals on the daily timeframe are warning of weakening demand. The RSI is currently at 51 and trending downward toward the neutral line, reflecting fading bullish momentum. At the same time, the MACD indicator continues to move sideways, with green histogram bars narrowing significantly, indicating a clear decline in bullish strength.
Conversely, if a recovery occurs and PUMP successfully breaks above the 50-day EMA at $0.002624, the price could regain upward momentum and target the resistance zone at the Pivot R1 point, around $0.002983.
Story faces a critical crossroads at the $2.00 mark
As of Thursday when this article was written, Story (IP) is hovering around the $2.00 level, marking its third consecutive decline. The price dropped 2% during the day, following a 4% decrease in the previous session, increasing correction pressure and putting this coin at risk of losing the 20-day EMA at around $1.91.
In a negative scenario, if IP breaks below the support level of $1.91, the decline could extend to the S1 Pivot point near $1.22.
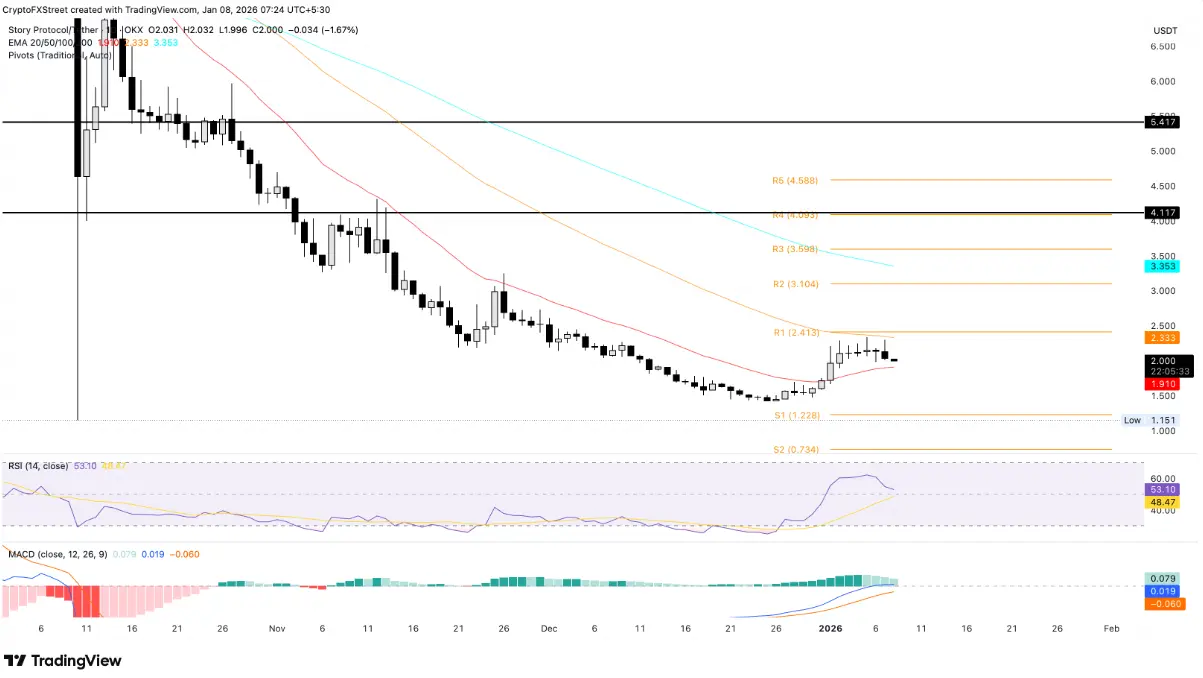 Daily IP/USDT chart | Source: TradingView Similar to PUMP, the technical indicators on the daily timeframe show that buying momentum for Story is weakening significantly. The RSI is currently at 53 and gradually approaching the neutral zone, while the MACD is nearing the signal line, increasing the risk of a bearish crossover — a sign that the correction trend may resume.
On the other hand, to restore bullish prospects, IP needs to decisively break above the 50-day EMA at $2.33. If successful, the price could target the Pivot R1 point around $2.41.
Pudgy Penguins at risk of losing the 50-day EMA
Pudgy Penguins remains resilient above the 50-day EMA at $0.01179, despite a sharp 9% correction on Wednesday. As of this writing, PENGU is fluctuating around $0.01200, close to the short-term resistance at the Pivot R1 level of $0.01193.
However, if the price loses this support zone, selling pressure could increase, pushing PENGU back to test the 20-day EMA at $0.01091 — near the important psychological level of $0.01000.
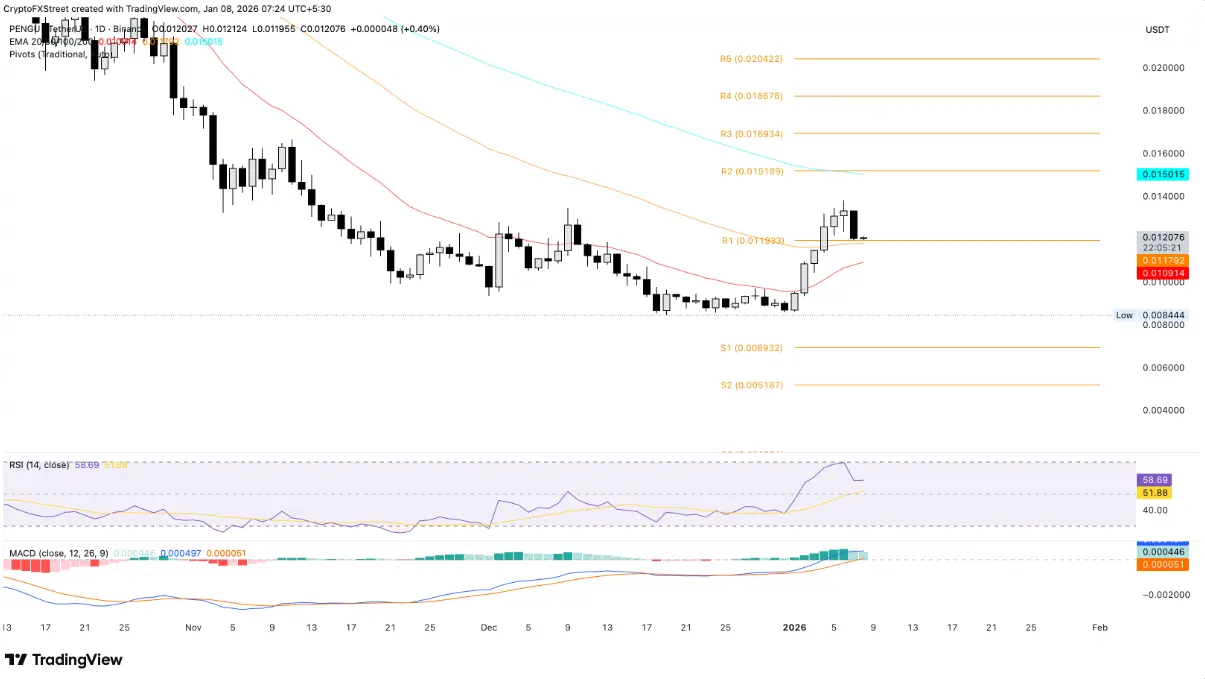 Daily PENGU/USDT chart | Source: TradingView Similar to PUMP and IP, the technical signals on the daily timeframe indicate that Pudgy Penguins’ buying momentum is weakening, implying short-term risks of correction.
In a more positive scenario, if demand returns, PENGU could initiate a recovery toward the next resistance zone at the Pivot R1 level of $0.01518.
Disclaimer: The information on this page may come from third parties and does not represent the views or opinions of Gate. The content displayed on this page is for reference only and does not constitute any financial, investment, or legal advice. Gate does not guarantee the accuracy or completeness of the information and shall not be liable for any losses arising from the use of this information. Virtual asset investments carry high risks and are subject to significant price volatility. You may lose all of your invested principal. Please fully understand the relevant risks and make prudent decisions based on your own financial situation and risk tolerance. For details, please refer to
Disclaimer.
Related Articles
Aster Price Nears $0.79 Breakout as Reversal Pattern Strengthens
Key Insights
Aster price structure shows an inverse head and shoulders pattern forming beneath $0.79 resistance, signaling growing buying pressure and possible trend reversal ahead.
Repeated tests of the $0.79 neckline suggest weakening selling pressure as buyers steadily absorb supply
CryptoFrontNews1h ago
The HYPE price could surge despite the upcoming $2.8 million short squeeze.
The recent price movements of Hyperliquid (HYPE) are characterized by stagnation around 30 USD. A symmetrical triangle pattern indicates potential for a breakout in either direction, but market sentiment is cautious. Short squeeze risks may boost prices, while weak market flow and deteriorating demand pose challenges. The token could face significant support levels if it dips below 30 USD. An improved market sentiment could lead to a breakout above 33 USD, sparking recovery momentum.
TapChiBitcoin2h ago
Ethereum Price Holds Key Support: Is $2,200 the Next Test for ETH?
March 6, 2026 7:15 pm EST
TheCoinRepublic4h ago
Cardano Price Trends: Bulls Eye Opportunity as Indicator Flashes Green
ADA: Trading near $0.27, facing resistance at $0.28 and support at $0.26.
Technical Indicators: RSI and MACD show weak momentum, signaling short-term consolidation and cautious trading.
Macro Outlook: Rising PMI and historical patterns suggest potential bullish rebound if resistance
CryptoNewsLand4h ago
CryptoQuant: Bitcoin NUPL--MVRV indicator reaches 0.33, or has entered the mid-stage of a bear market
Gate News Announcement, March 7th, CryptoQuant analyst Axel pointed out on the X platform that the Bitcoin NUPL--MVRV harmonic composite indicator has reached 0.33, while historical cycle bottoms typically occur around the 0.5 range. The chart shows that the bear market cycle is beginning to shift upward, indicating that Bitcoin may have entered the mid-stage of this bear market cycle, suggesting that extreme selling conditions are easing. However, this indicator is still well above historical bottom levels, implying that a market-wide bottom has not yet been confirmed.
GateNews4h ago
ZEC Price Analysis: Upcoming Trends and Targets for the Next Few Weeks
ZEC: Stabilized near $200 support, rebounding toward $250 resistance after prolonged bearish pressure.
Technical Indicators: RSI and MACD show gradual improvement, signaling moderate bullish momentum returning.
Market Outlook: Sustained above $240 could push ZEC toward $268, while
CryptoNewsLand5h ago